
Compare Zydus Lifesci. with Similar Stocks
Dashboard
Low Debt Company with Strong Long Term Fundamental Strength
- Healthy long term growth as Net Sales has grown by an annual rate of 13.40% and Operating profit at 22.89%
- Company has a Debt to Equity ratio (avg) of 0.05 times
- The company has been able to generate a Return on Equity (avg) of 17.49% signifying high profitability per unit of shareholders funds
With ROCE of 21.8, it has a Attractive valuation with a 3.6 Enterprise value to Capital Employed
Majority shareholders : Promoters
Company is among the highest 1% of companies rated by MarketsMojo across all 4,000 stocks
Market Beating performance in long term as well as near term
Stock DNA
Pharmaceuticals & Biotechnology
INR 112,492 Cr (Mid Cap)
20.00
35
0.99%
0.20
20.09%
4.13
Total Returns (Price + Dividend) 
Latest dividend: 11 per share ex-dividend date: Jul-25-2025
Risk Adjusted Returns v/s
Returns Beta

News

Zydus Lifesciences Sees Significant Open Interest Surge Amid Mixed Market Signals
Zydus Lifesciences Ltd has witnessed a notable 12.7% increase in open interest in its derivatives segment, signalling heightened market activity and shifting investor positioning. Despite a slight dip in the stock price, the surge in open interest alongside robust volume patterns suggests evolving directional bets within the Pharmaceuticals & Biotechnology sector.
Read full news article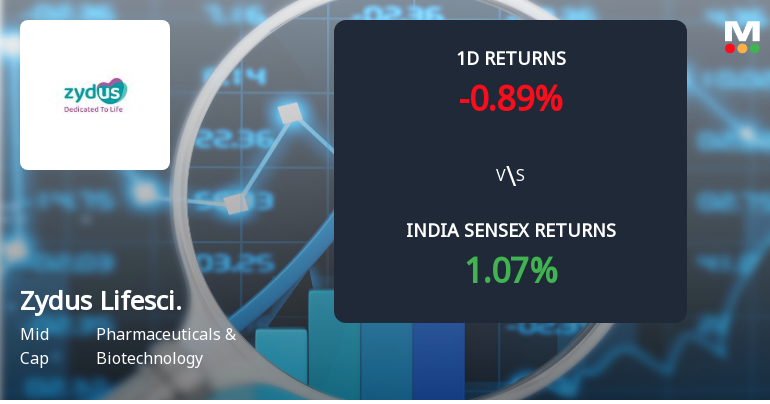
Zydus Lifesciences Sees Significant Open Interest Surge Amid Mixed Market Signals
Zydus Lifesciences Ltd, a mid-cap player in the Pharmaceuticals & Biotechnology sector, has witnessed a notable 10.6% surge in open interest in its derivatives segment, signalling heightened market activity despite a modest price decline. This development comes alongside a fresh 52-week high and increased investor participation, reflecting a complex interplay of bullish and cautious positioning among traders.
Read full news article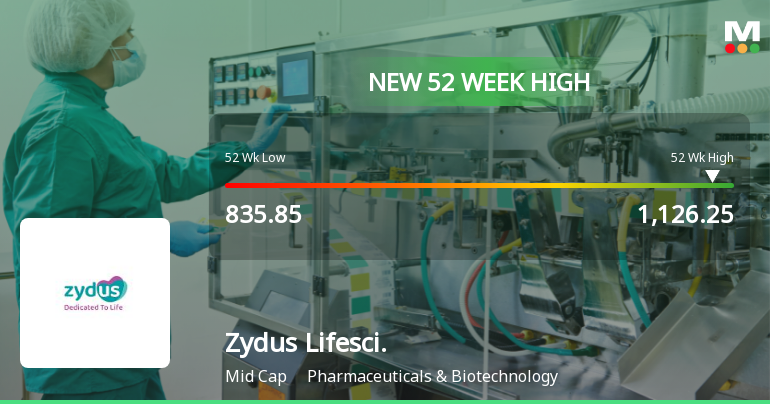
Broad-Based Technical Strength Lifts Zydus Lifesciences Ltd to 52-Week High of Rs 1126.25
With a decisive breakout to Rs 1126.25 on 24 Jun 2026, Zydus Lifesciences Ltd has reached a fresh 52-week high, propelled by a confluence of bullish technical indicators and sustained price momentum over recent sessions.
Read full news article Announcements
Disclosures Under SEBI (Prohibition Of Insider Trading) Regulations 2015
20-Jun-2026 | Source : BSEDisclosures under SEBI (Prohibition of Insider Trading) Regulations 2015
Corporate Action-Updates on Buy back
19-Jun-2026 | Source : BSEExtinguishment Certificate
Corporate Action-Updates on Buy back
18-Jun-2026 | Source : BSEPost Buyback Public Advertisement
Corporate Actions

No Upcoming Board Meetings

Zydus Lifesciences Ltd has declared 100% dividend, ex-date: 24 Jul 26

Zydus Lifesciences Ltd has announced 1:5 stock split, ex-date: 06 Oct 15

Zydus Lifesciences Ltd has announced 1:2 bonus issue, ex-date: 05 Apr 10

No Rights history available
Quality key factors
Valuation key factors
Technicals key factors
 Technical Indicator Scale: Bearish, Mildly Bearish, Sideways, Mildly Bullish, Bullish Turned
 Shareholding Snapshot : Mar 2026
Shareholding Compare (%holding)
Promoters
None
Held by 35 Schemes (4.88%)
Held by 626 FIIs (6.95%)
Zydus Family Trust (pankaj R. Patel, Pritiben P. Patel And Sharvil P. Patel-trustees) (74.96%)
Life Insurance Corporation Of India (5.55%)
5.54%
Quarterly Results Snapshot (Consolidated) - Mar'26 - YoY

YoY Growth in quarter ended Mar 2026 is 16.22% vs 17.96% in Mar 2025

YoY Growth in quarter ended Mar 2026 is 8.68% vs -0.96% in Mar 2025
Half Yearly Results Snapshot (Consolidated) - Sep'25
Growth in half year ended Sep 2025 is 10.94% vs 20.36% in Sep 2024
Growth in half year ended Sep 2025 is 16.91% vs 23.50% in Sep 2024
Nine Monthly Results Snapshot (Consolidated) - Dec'25
YoY Growth in nine months ended Dec 2025 is 17.04% vs 19.27% in Dec 2024
YoY Growth in nine months ended Dec 2025 is 12.31% vs 25.30% in Dec 2024
Annual Results Snapshot (Consolidated) - Mar'26
YoY Growth in year ended Mar 2026 is 16.81% vs 18.90% in Mar 2025
YoY Growth in year ended Mar 2026 is 11.37% vs 17.26% in Mar 2025
About Zydus Lifesciences Ltd

Company Coordinates


