
Compare Credent Global with Similar Stocks
Dashboard
Strong Long Term Fundamental Strength with a 46.49% CAGR growth in Operating Profits
Healthy long term growth as Net Sales has grown by an annual rate of 33.21% and Operating profit at 46.49%
The company has declared Positive results for the last 5 consecutive quarters
With ROE of 18.2, it has a Very Attractive valuation with a 1.3 Price to Book Value
Falling Participation by Institutional Investors
Market Beating Performance
Stock DNA
Non Banking Financial Company (NBFC)
INR 181 Cr (Micro Cap)
7.00
21
0.00%
0.76
18.24%
1.34
Total Returns (Price + Dividend) 
Latest dividend: 0.09737669902912623 per share ex-dividend date: Feb-21-2023
Risk Adjusted Returns v/s
Returns Beta

News
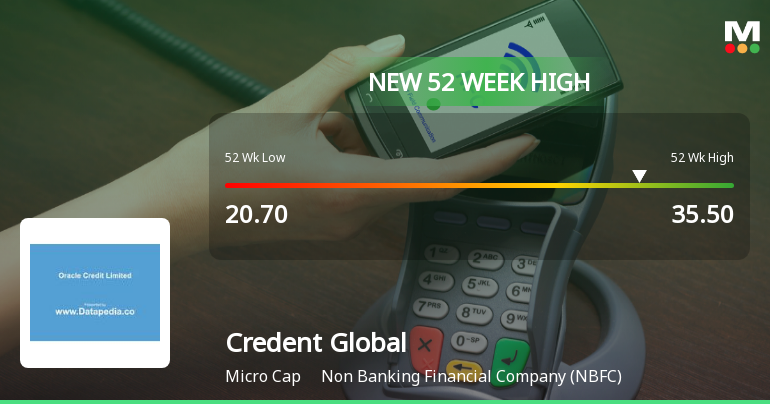
Broad-Based Technical Strength Lifts Credent Global Finance Ltd to 52-Week High of Rs 35.5
Surging to an intraday peak of Rs 35.5 on 30 Jun 2026, Credent Global Finance Ltd has marked a significant milestone by reaching its highest price in the past 52 weeks. This rally, underpinned by a confluence of technical indicators, reflects robust momentum despite a broadly volatile market backdrop.
Read full news article
Credent Global Finance Ltd is Rated Hold
Credent Global Finance Ltd is rated 'Hold' by MarketsMOJO, with this rating last updated on 15 June 2026. However, the analysis and financial metrics presented here reflect the stock's current position as of 25 June 2026, providing investors with the most recent insights into the company’s performance and outlook.
Read full news article
Credent Global Finance Ltd is Rated Sell
Credent Global Finance Ltd is rated 'Sell' by MarketsMOJO, with this rating last updated on 08 June 2026. However, the analysis and financial metrics presented here reflect the stock's current position as of 14 June 2026, providing investors with the latest insights into its performance and outlook.
Read full news article Announcements
Disclosures under Reg. 29(2) of SEBI (SAST) Regulations 2011
27-Jun-2026 | Source : BSEThe Exchange has received the disclosure under Regulation 29(2) of SEBI (Substantial Acquisition of Shares & Takeovers) Regulations 2011 for DP Global Wealth Management LLP & Vikas Kataria
Disclosures under Reg. 29(2) of SEBI (SAST) Regulations 2011
27-Jun-2026 | Source : BSEThe Exchange has received the disclosure under Regulation 29(2) of SEBI (Substantial Acquisition of Shares & Takeovers) Regulations 2011 for Dilip Nanji Chheda & Nayna Dilip Chheda
Closure of Trading Window
26-Jun-2026 | Source : BSEEnclosed herewith intimation for Closure of Trading for the Quarter Ended June 30 2026.
Corporate Actions

No Upcoming Board Meetings

Credent Global Finance Ltd has declared 5% dividend, ex-date: 21 Feb 23

Credent Global Finance Ltd has announced 2:10 stock split, ex-date: 15 Oct 24

No Bonus history available

Credent Global Finance Ltd has announced 1:2 rights issue, ex-date: 17 Jul 23
Quality key factors
Valuation key factors
Technicals key factors
 Technical Indicator Scale: Bearish, Mildly Bearish, Sideways, Mildly Bullish, Bullish Turned
 Shareholding Snapshot : Mar 2026
Shareholding Compare (%holding)
Non Institution
None
Held by 0 Schemes
Held by 4 FIIs (15.86%)
Aditya Vikram Kanoria (13.14%)
Supriya Kataria (8.06%)
22.2%
Quarterly Results Snapshot (Consolidated) - Mar'26 - QoQ

QoQ Growth in quarter ended Mar 2026 is -88.21% vs 113.45% in Dec 2025
QoQ Growth in quarter ended Mar 2026 is -99.94% vs 146.70% in Dec 2025
Half Yearly Results Snapshot (Consolidated) - Sep'25

Growth in half year ended Sep 2025 is 79.66% vs 77.01% in Sep 2024
Growth in half year ended Sep 2025 is 174.70% vs -1,222.67% in Sep 2024
Nine Monthly Results Snapshot (Consolidated) - Dec'25
YoY Growth in nine months ended Dec 2025 is 248.20% vs 50.19% in Dec 2024
YoY Growth in nine months ended Dec 2025 is 349.00% vs -821.10% in Dec 2024
Annual Results Snapshot (Consolidated) - Mar'26
YoY Growth in year ended Mar 2026 is 197.41% vs 18.43% in Mar 2025
YoY Growth in year ended Mar 2026 is 471.07% vs -602.99% in Mar 2025
About Credent Global Finance Ltd

Company Coordinates


