
Compare Antony Waste han with Similar Stocks
Stock DNA
Other Utilities
INR 1,385 Cr (Micro Cap)
18.00
32
0.00%
0.45
10.21%
1.82
Total Returns (Price + Dividend) 
Antony Waste han for the last several years.
Risk Adjusted Returns v/s
Returns Beta

News
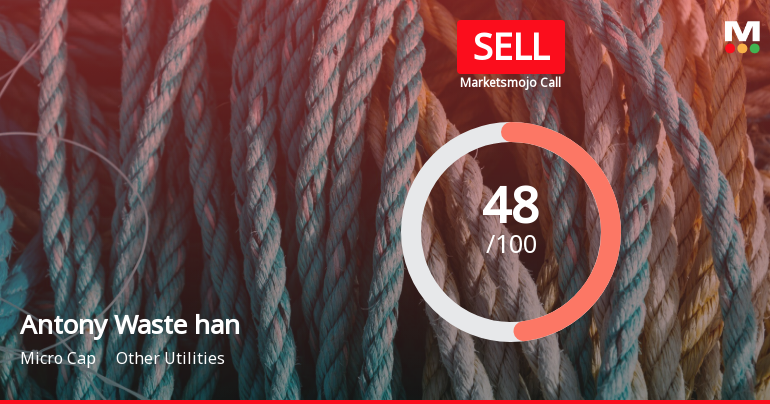
Antony Waste Handling Cell Ltd is Rated Sell
Antony Waste Handling Cell Ltd is rated 'Sell' by MarketsMOJO, with this rating last updated on 19 May 2026. However, the analysis and financial metrics discussed here reflect the stock's current position as of 22 June 2026, providing investors with an up-to-date view of the company’s fundamentals, valuation, financial trends, and technical outlook.
Read full news article
Antony Waste Handling Cell Ltd Sees Technical Momentum Shift Amid Mixed Market Signals
Antony Waste Handling Cell Ltd, a micro-cap player in the Other Utilities sector, has experienced a notable shift in its technical momentum, moving from a strongly bearish stance to a mildly bearish outlook. Despite a modest day gain of 1.14%, the stock’s technical indicators present a complex picture, reflecting mixed signals that investors should carefully analyse amid broader market trends.
Read full news article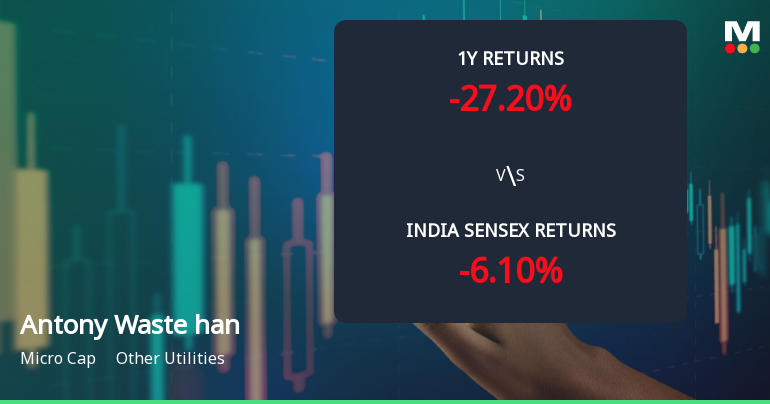
Antony Waste Handling Cell Ltd Technical Momentum Shifts Amid Bearish Signals
Antony Waste Handling Cell Ltd has experienced a notable shift in its technical momentum, moving from a mildly bearish stance to a more pronounced bearish trend. Despite a modest uptick in the daily price, key technical indicators such as MACD, moving averages, and Bollinger Bands signal caution for investors amid a challenging market backdrop.
Read full news article Announcements
Announcement under Regulation 30 (LODR)-Earnings Call Transcript
04-Jun-2026 | Source : BSEPlease find attached intimation w.r.t transcript of earning held on June 01 2026
Announcement under Regulation 30 (LODR)-Analyst / Investor Meet - Outcome
01-Jun-2026 | Source : BSEPlease find attached intimation w.r.t Audio Recording of Earning Call
Announcement under Regulation 30 (LODR)-Investor Presentation
01-Jun-2026 | Source : BSEPlese find attached Investor Presentation for Q4&FY26
Corporate Actions

No Upcoming Board Meetings

No Dividend history available

No Splits history available

No Bonus history available

No Rights history available
Quality key factors
Valuation key factors
Technicals key factors
 Technical Indicator Scale: Bearish, Mildly Bearish, Sideways, Mildly Bullish, Bullish Turned
 Shareholding Snapshot : Mar 2026
Shareholding Compare (%holding)
Promoters
0.2294
Held by 1 Schemes (2.25%)
Held by 36 FIIs (14.78%)
Jose Jacob Kallarakal (18.4%)
Massachusetts Institute Of Technology (6.93%)
28.5%
Quarterly Results Snapshot (Consolidated) - Mar'26 - QoQ

QoQ Growth in quarter ended Mar 2026 is 8.89% vs 1.86% in Dec 2025
QoQ Growth in quarter ended Mar 2026 is 182.78% vs -15.75% in Dec 2025
Half Yearly Results Snapshot (Consolidated) - Sep'25
Growth in half year ended Sep 2025 is 12.67% vs 0.59% in Sep 2024
Growth in half year ended Sep 2025 is 6.22% vs -35.53% in Sep 2024
Nine Monthly Results Snapshot (Consolidated) - Dec'25
YoY Growth in nine months ended Dec 2025 is 11.07% vs 4.26% in Dec 2024
YoY Growth in nine months ended Dec 2025 is -5.34% vs -22.74% in Dec 2024
Annual Results Snapshot (Consolidated) - Mar'26
YoY Growth in year ended Mar 2026 is 12.81% vs 7.14% in Mar 2025

YoY Growth in year ended Mar 2026 is -11.61% vs -0.99% in Mar 2025
About Antony Waste Handling Cell Ltd

Company Coordinates


