
Compare Antony Waste han with Similar Stocks
Stock DNA
Other Utilities
INR 1,223 Cr (Micro Cap)
16.00
32
0.00%
0.45
10.21%
1.67
Total Returns (Price + Dividend) 
Antony Waste han for the last several years.
Risk Adjusted Returns v/s
Returns Beta

News

Antony Waste Handling Cell Ltd is Rated Sell
Antony Waste Handling Cell Ltd is rated 'Sell' by MarketsMOJO, with this rating last updated on 19 May 2026. However, the analysis and financial metrics discussed here reflect the stock's current position as of 25 July 2026, providing investors with an up-to-date perspective on the company’s fundamentals, valuation, financial trend, and technical outlook.
Read full news article
Antony Waste Handling Cell Ltd is Rated Sell
Antony Waste Handling Cell Ltd is rated 'Sell' by MarketsMOJO, with this rating last updated on 19 May 2026. However, the analysis and financial metrics discussed here reflect the stock's current position as of 14 July 2026, providing investors with an up-to-date view of the company’s fundamentals, valuation, financial trends, and technical outlook.
Read full news article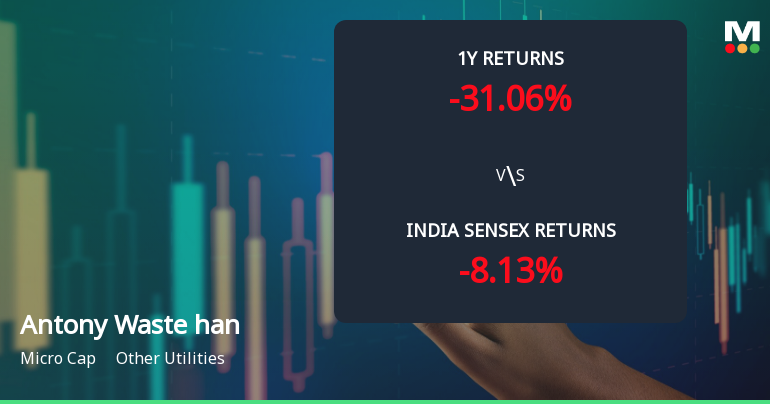
Antony Waste Handling Cell Ltd Technical Momentum Shifts Amid Bearish Trends
Antony Waste Handling Cell Ltd has experienced a notable shift in its technical momentum, with key indicators signalling a transition from mildly bearish to bearish trends. Despite a modest day gain of 0.48%, the stock’s broader technical landscape reveals mixed signals, underscoring the challenges faced by this micro-cap player in the Other Utilities sector.
Read full news article Announcements
Announcement under Regulation 30 (LODR)-Newspaper Publication
29-Jul-2026 | Source : BSEPlease find attached intimation w.r.t. Newspaper Publication - Public Notice for Twenty-FIfth Annual General Meeting of the Company.
Intimation Of Date Of 25Th Annual General Meeting And Record Date For Payment Of Final Dividend On Equity Shares For The Financial Year 2025-26
28-Jul-2026 | Source : BSEPlease find attached intimation w.r.t date of 25th Annual General Meeting and Record Date for payment of final dividend on equity shares for the financial year 2025-26
Announcement under Regulation 30 (LODR)-Acquisition
28-Jul-2026 | Source : BSEPlease find intimation w.r.t Acquisition of 26% stake in Arts EV Private Limited consequent upon execution of Share Purchase Agreement and Shareholders Agreement
Corporate Actions

No Upcoming Board Meetings

Antony Waste Handling Cell Ltd has declared 10% dividend, ex-date: 13 Aug 26

No Splits history available

No Bonus history available

No Rights history available
Quality key factors
Valuation key factors
Technicals key factors
 Technical Indicator Scale: Bearish, Mildly Bearish, Sideways, Mildly Bullish, Bullish Turned
 Shareholding Snapshot : Jun 2026
Shareholding Compare (%holding)
Promoters
0.2294
Held by 1 Schemes (2.33%)
Held by 35 FIIs (13.08%)
Jose Jacob Kallarakal (18.4%)
Massachusetts Institute Of Technology (6.93%)
30.02%
Quarterly Results Snapshot (Consolidated) - Mar'26 - QoQ

QoQ Growth in quarter ended Mar 2026 is 8.89% vs 1.86% in Dec 2025
QoQ Growth in quarter ended Mar 2026 is 182.78% vs -15.75% in Dec 2025
Half Yearly Results Snapshot (Consolidated) - Sep'25
Growth in half year ended Sep 2025 is 12.67% vs 0.59% in Sep 2024
Growth in half year ended Sep 2025 is 6.22% vs -35.53% in Sep 2024
Nine Monthly Results Snapshot (Consolidated) - Dec'25
YoY Growth in nine months ended Dec 2025 is 11.07% vs 4.26% in Dec 2024
YoY Growth in nine months ended Dec 2025 is -5.34% vs -22.74% in Dec 2024
Annual Results Snapshot (Consolidated) - Mar'26
YoY Growth in year ended Mar 2026 is 12.81% vs 7.14% in Mar 2025

YoY Growth in year ended Mar 2026 is -11.61% vs -0.99% in Mar 2025
About Antony Waste Handling Cell Ltd

Company Coordinates


