
Compare G R Infraproject with Similar Stocks
Stock DNA
Construction
INR 8,764 Cr (Small Cap)
10.00
47
0.28%
0.36
9.28%
0.92
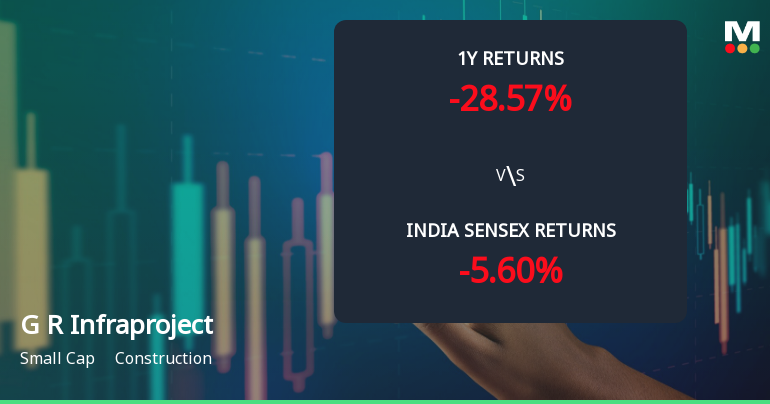
Total Returns (Price + Dividend) 
Latest dividend: 2.503064351378958 per share ex-dividend date: Feb-18-2026
Risk Adjusted Returns v/s
Returns Beta

News
G R Infraprojects Ltd Technical Momentum Shifts Amid Mixed Market Signals
G R Infraprojects Ltd has experienced a nuanced shift in its technical momentum, reflecting a complex interplay of bullish and bearish signals across multiple timeframes. Despite a modest daily price increase, the construction sector stock remains under pressure with a downgraded rating and mixed indicator readings, signalling cautious investor sentiment.
Read full news article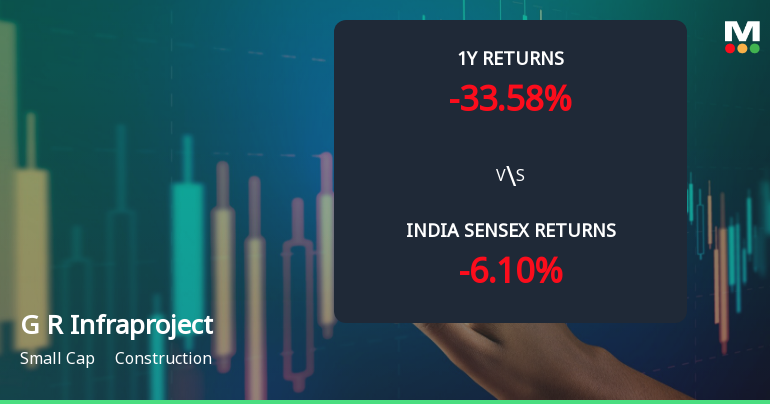
G R Infraprojects Ltd Technical Momentum Shifts Amid Bearish Outlook
G R Infraprojects Ltd, a small-cap player in the construction sector, has experienced a notable shift in its technical momentum, prompting a downgrade in its Mojo Grade from Hold to Sell as of 16 Oct 2025. The stock’s price action and technical indicators reveal a bearish tilt, reflecting challenges in sustaining upward momentum amid broader market fluctuations.
Read full news article
G R Infraprojects Ltd Technical Momentum Shifts Amid Bearish Sentiment
G R Infraprojects Ltd has experienced a subtle shift in its technical momentum, moving from a bearish to a mildly bearish trend, reflecting mixed signals across key indicators such as MACD, RSI, and moving averages. Despite a 3.36% gain on 16 Jun 2026, the stock remains under pressure amid a challenging construction sector environment and a downgraded MarketsMOJO rating to Sell.
Read full news article Announcements
Recommendation For Appointment Of Statutory Auditors.
20-Jun-2026 | Source : BSERecommendation for appointment of Statutory Auditors.
Disclosures under Reg. 10(5) in respect of acquisition under Reg. 10(1)(a) of SEBI (SAST) Regulations 2011
17-Jun-2026 | Source : BSEThe Exchange has received the disclosure under Regulation 10(5) in respect of acquisition under Regulation 10(1)(a) of SEBI (Substantial Acquisition of Shares & Takeovers) Regulations 2011 for Devki Nandan Agarwal & Others
Intimation Of Declaration Of Appointed Date
15-Jun-2026 | Source : BSEIntimation of declaration of Appointed Date
Corporate Actions

No Upcoming Board Meetings

G R Infraprojects Ltd has declared 50% dividend, ex-date: 18 Feb 26

No Splits history available

No Bonus history available

No Rights history available
Quality key factors
Valuation key factors
Technicals key factors
 Technical Indicator Scale: Bearish, Mildly Bearish, Sideways, Mildly Bullish, Bullish Turned
 Shareholding Snapshot : Mar 2026
Shareholding Compare (%holding)
Promoters
None
Held by 10 Schemes (19.53%)
Held by 88 FIIs (2.32%)
Lokesh Builders Private Limited (31.8%)
Sbi Mutual Fund (7.47%)
1.88%
Quarterly Results Snapshot (Consolidated) - Mar'26 - QoQ

QoQ Growth in quarter ended Mar 2026 is 8.32% vs 44.07% in Dec 2025
QoQ Growth in quarter ended Mar 2026 is -20.15% vs 34.57% in Dec 2025
Half Yearly Results Snapshot (Consolidated) - Sep'25

Growth in half year ended Sep 2025 is 4.83% vs -21.47% in Sep 2024
Growth in half year ended Sep 2025 is 25.22% vs -33.83% in Sep 2024
Nine Monthly Results Snapshot (Consolidated) - Dec'25
YoY Growth in nine months ended Dec 2025 is 15.22% vs -21.18% in Dec 2024
YoY Growth in nine months ended Dec 2025 is 13.99% vs -20.69% in Dec 2024
Annual Results Snapshot (Consolidated) - Mar'26
YoY Growth in year ended Mar 2026 is 13.58% vs -17.66% in Mar 2025
YoY Growth in year ended Mar 2026 is -10.99% vs -23.37% in Mar 2025
About G R Infraprojects Ltd

Company Coordinates


