
Compare Krishival Foods with Similar Stocks
Dashboard
Company has a Debt to Equity ratio (avg) of 0.01 times
Healthy long term growth as Net Sales has grown by an annual rate of 59.80% and Operating profit at 67.30%
The company has declared Positive results for the last 3 consecutive quarters
With ROE of 11.2, it has a Very Expensive valuation with a 5.4 Price to Book Value
Despite the size of the company, domestic mutual funds hold only 0% of the company
Stock DNA
Other Agricultural Products
INR 1,040 Cr (Micro Cap)
48.00
38
0.04%
0.04
11.15%
5.39
Total Returns (Price + Dividend) 
Latest dividend: 0.1888 per share ex-dividend date: Sep-18-2025
Risk Adjusted Returns v/s
Returns Beta

News

Krishival Foods Ltd is Rated Hold by MarketsMOJO
Krishival Foods Ltd is rated 'Hold' by MarketsMOJO, with this rating last updated on 08 June 2026. However, the analysis and financial metrics discussed here reflect the company’s current position as of 15 June 2026, providing investors with the latest insights into its performance and outlook.
Read full news article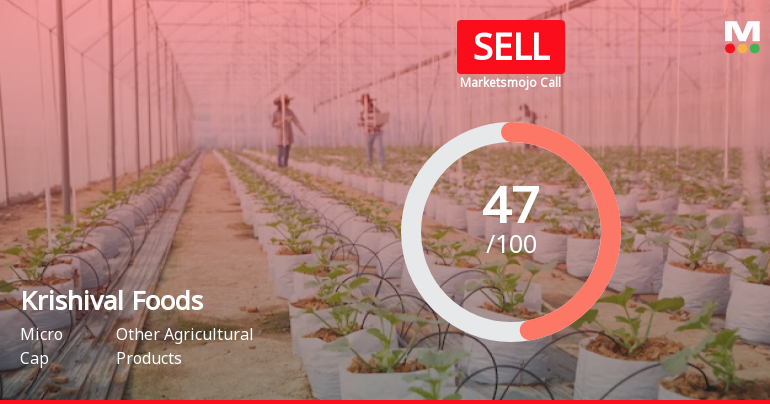
Krishival Foods Ltd is Rated Sell
Krishival Foods Ltd is rated 'Sell' by MarketsMOJO, with this rating last updated on 01 June 2026. However, the analysis and financial metrics discussed here reflect the stock's current position as of 04 June 2026, providing investors with the most up-to-date perspective on the company’s performance and outlook.
Read full news article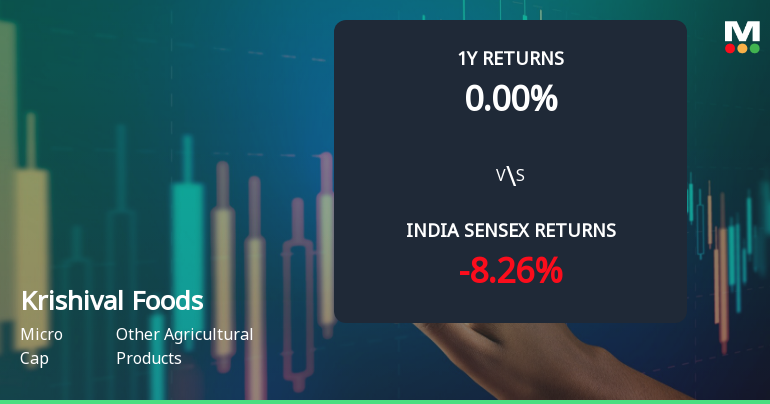
Krishival Foods Ltd Sees Technical Momentum Shift Amid Mixed Indicator Signals
Krishival Foods Ltd, a micro-cap player in the Other Agricultural Products sector, has experienced a notable shift in its technical momentum, moving from a sideways trend to a mildly bullish stance. Despite mixed signals from key indicators such as MACD, RSI, and moving averages, the stock’s recent performance and technical adjustments suggest cautious optimism among investors.
Read full news article Announcements
Outcome Of Plant Visit Of Investor
20-Jun-2026 | Source : BSEOutcome of Plant Visit of Investor
Announcement under Regulation 30 (LODR)-Analyst / Investor Meet - Outcome
18-Jun-2026 | Source : BSEPost - Intimation of scheduled Investor/Analyst Interaction
Announcement under Regulation 30 (LODR)-Analyst / Investor Meet - Outcome
17-Jun-2026 | Source : BSEPost - Intimation of scheduled Investor/Analyst Interaction
Corporate Actions

No Upcoming Board Meetings

Krishival Foods Ltd has declared 2% dividend, ex-date: 18 Sep 25

No Splits history available

No Bonus history available

Krishival Foods Ltd has announced 45:301 rights issue, ex-date: 17 Dec 25
Quality key factors
Valuation key factors
Technicals key factors
 Technical Indicator Scale: Bearish, Mildly Bearish, Sideways, Mildly Bullish, Bullish Turned
 Shareholding Snapshot : Mar 2026
Shareholding Compare (%holding)
Non Institution
None
Held by 0 Schemes
Held by 5 FIIs (0.54%)
Aparna Sujit Bangar (34.85%)
Syed Zafar Islam (16%)
35.88%
Quarterly Results Snapshot (Standalone) - Mar'26 - QoQ

QoQ Growth in quarter ended Mar 2026 is 10.67% vs 3.39% in Dec 2025

QoQ Growth in quarter ended Mar 2026 is -9.01% vs 8.69% in Dec 2025
Half Yearly Results Snapshot (Consolidated) - Sep'25
Growth in half year ended Sep 2025 is -9.54% vs 74.06% in Mar 2025
Growth in half year ended Sep 2025 is 88.57% vs -36.67% in Mar 2025
Nine Monthly Results Snapshot (Consolidated) - Dec'25
YoY Growth in nine months ended Dec 2025 is 48.34% vs -16.37% in Dec 2024
YoY Growth in nine months ended Dec 2025 is 69.92% vs -9.84% in Dec 2024
Annual Results Snapshot (Consolidated) - Mar'26
YoY Growth in year ended Mar 2026 is 44.72% vs 97.11% in Mar 2025
YoY Growth in year ended Mar 2026 is 58.64% vs 44.81% in Mar 2025
About Krishival Foods Ltd

Company Coordinates


