
Compare Aether Industri. with Similar Stocks
Dashboard
Company has a Debt to Equity ratio (avg) of 0.06 times
Flat results in Mar 26
With ROCE of 10.2, it has a Very Expensive valuation with a 7 Enterprise value to Capital Employed
Falling Participation by Institutional Investors
Market Beating performance in long term as well as near term
Stock DNA
Specialty Chemicals
INR 20,836 Cr (Small Cap)
88.00
44
0.00%
0.18
9.21%
8.07
Total Returns (Price + Dividend) 
Aether Industri. for the last several years.
Risk Adjusted Returns v/s
Returns Beta

News
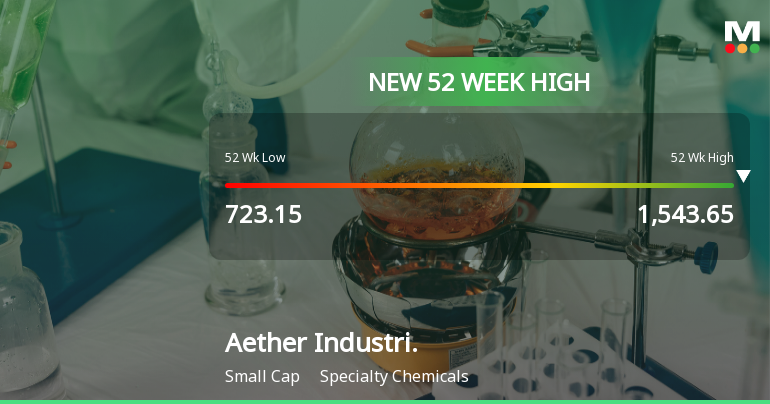
Broad-Based Technical Strength Lifts Aether Industries Ltd to 52-Week High of Rs 1549
Surging past its previous peaks, Aether Industries Ltd touched a new 52-week high of Rs 1549 on 31 Jul 2026, marking a remarkable 102.54% gain over the past year. This milestone comes amid a backdrop of strong technical momentum and a market environment where the Sensex has remained relatively flat, underscoring the stock's standout performance within the Specialty Chemicals sector.
Read full news article
Aether Industries Ltd Hits All-Time High of Rs 1,543.65 as Momentum Builds Across Timeframes
Extending its remarkable rally, Aether Industries Ltd surged to a fresh all-time high of Rs 1,543.65 on 31 Jul 2026, outperforming the Sensex by nearly 4 percentage points in a single session. This milestone caps a year of extraordinary gains, with the stock more than doubling over the past 12 months despite a broadly negative market backdrop.
Read full news article Announcements
Announcement under Regulation 30 (LODR)-Analyst / Investor Meet - Intimation
27-Jul-2026 | Source : BSEIn accordance with Regulation 30 of the SEBI (Listing Obligations and Disclosure Requirements) Regulations 2015 this is to inform you that Earnings Conference Call is scheduled on Friday July 31 2026 from 15.30 Hrs. as annexed.
Board Meeting Intimation for The Meeting To Be Held On Friday July 31 2026.
22-Jul-2026 | Source : BSEAether Industries Ltdhas informed BSE that the meeting of the Board of Directors of the Company is scheduled on 31/07/2026 inter alia to consider and approve as annexed.
Grant Of Employee Stock Options
08-Jul-2026 | Source : BSEIn accordance with Reg. 30 of the SEBI (Listing Obligations and Disclosure Requirements) Regulations 2015 we herewith inform about the grant of 177996 stock options to employees as annexed.
Corporate Actions

(31 Jul 2026)

No Dividend history available

No Splits history available

No Bonus history available

No Rights history available
Quality key factors
Valuation key factors
Technicals key factors
 Technical Indicator Scale: Bearish, Mildly Bearish, Sideways, Mildly Bullish, Bullish Turned
 Shareholding Snapshot : Jun 2026
Shareholding Compare (%holding)
Promoters
None
Held by 15 Schemes (9.68%)
Held by 103 FIIs (7.42%)
Purnima Ashwin Desai (17.4%)
Sbi Multicap Fund (8.63%)
5.18%
Quarterly Results Snapshot (Consolidated) - Mar'26 - QoQ

QoQ Growth in quarter ended Mar 2026 is -4.29% vs 13.81% in Dec 2025
QoQ Growth in quarter ended Mar 2026 is -16.24% vs 19.50% in Dec 2025
Half Yearly Results Snapshot (Consolidated) - Sep'25

Growth in half year ended Sep 2025 is 40.24% vs 16.46% in Sep 2024
Growth in half year ended Sep 2025 is 56.00% vs -2.65% in Sep 2024
Nine Monthly Results Snapshot (Consolidated) - Dec'25
YoY Growth in nine months ended Dec 2025 is 42.03% vs 24.52% in Dec 2024
YoY Growth in nine months ended Dec 2025 is 53.03% vs 28.84% in Dec 2024
Annual Results Snapshot (Consolidated) - Mar'26
YoY Growth in year ended Mar 2026 is 38.33% vs 40.21% in Mar 2025
YoY Growth in year ended Mar 2026 is 38.53% vs 92.05% in Mar 2025
About Aether Industries Ltd

Company Coordinates


