Concord Biotech

  • Market Cap: Small Cap
  • Industry: Pharmaceuticals & Biotechnology
  • ISIN: INE338H01029
  • NSEID: CONCORDBIO
  • BSEID: 543960
INR
1,563.00
49.6 (3.28%)
BSENSE

Aug 18, 11:04 AM

BSE+NSE Vol: 2.16 lacs

  • Price Points
  • Score
  • Mojo Parameters
  • Total Return
  • News and Corporate Actions
  • Key factors
  • Shareholding
  • Financials
  • CompanyCV
stock-summaryPrice Point
High/Low

1Day

52 Week

Valuation
Technical
Day's Volume

CASH

2.16 lacs (41.00%) Volume

Shareholding (Jun 2026)

FII

7.52%

Held by 95 FIIs

DII

9.37%

Held by 11 DIIs

Promoter

44.08%

Why is Concord Biotech Ltd falling/rising?

18-Aug-2026

As of 17-Aug, Concord Biotech Ltd's stock price is rising to 1,520.85, up 5.17%, driven by strong performance against the Sensex and positive technical indicators. Despite a slight decline in investor participation, the company's solid fundamentals support continued investor confidence.

As of 17-Aug, Concord Biotech Ltd's stock price is rising, currently at 1,520.85, reflecting an increase of 74.75 (5.17%). This upward movement is supported by several factors. Over the past week, the stock has outperformed the benchmark Sensex, gaining 7.33% compared to the Sensex's decline of 1.04%. Additionally, the stock has shown a strong performance over the past month, with a rise of 13.53%, while the Sensex has decreased by 0.54%.<BR><BR>Today's performance indicates that Concord Biotech has outperformed its sector by 5.47%. The stock reached an intraday high of Rs 1535, marking a 6.15% increase. Furthermore, it is trading above its moving averages across various time frames, including the 5-day, 20-day, 50-day, 100-day, and 200-day averages, which is a positive technical indicator.<BR><BR>Despite a slight decline in investor participation, with a delivery volume decrease of 3.31% against the 5-day average, the stock remains liquid enough for trading. The company's strong fundamentals, including high management efficiency with a return on equity (ROE) of 17.91% and being net-debt free, contribute to investor confidence, supporting the stock's rise. Overall, these factors collectively explain the upward trend in Concord Biotech Ltd's stock price.

View full answer

Who are in the management team of Concord Biotech?

14-Aug-2026

The management team of Concord Biotech includes Chairman Sudhir Jairam Vaid, Joint Managing Director & CEO Ankur Vaid, and several independent and non-executive directors, responsible for guiding the company's strategic direction and operations. Key members also include Vice President & Company Secretary S Prakash.

The management team of Concord Biotech includes the following key members:<BR><BR>1. **Sudhir Jairam Vaid** - Chairman & Managing Director<BR>2. **Ankur Vaid** - Joint Managing Director & CEO<BR>3. **Ravi Kapoor** - Non-Executive Director<BR>4. **Rajiv Agarwal** - Nominee<BR>5. **Utpal Sheth** - Nominee<BR>6. **Amit Varma** - Nominee<BR>7. **Bharti Khanna** - Independent Director<BR>8. **Anil Katyal** - Independent Director<BR>9. **Amitabh Thakore** - Independent Director<BR>10. **Arvind Agarwal** - Independent Director<BR>11. **Jayaram Easwaran** - Independent Director<BR>12. **Mandayam Chakravarthy Sriraman** - Independent Director<BR>13. **S Prakash** - Vice President & Company Secretary<BR><BR>This team is responsible for guiding the strategic direction and operations of the company.

View full answer

What does Concord Biotech do?

14-Aug-2026

Concord Biotech Ltd is a small-cap company in the Pharmaceuticals & Biotechnology industry, reporting net sales of ₹257 Cr and a net profit of ₹59 Cr for June 2026. It has a market cap of ₹14,988 Cr, a P/E ratio of 55.00, and a dividend yield of 1.26%.

Overview: <BR>Concord Biotech Ltd operates in the Pharmaceuticals & Biotechnology industry and is classified as a Small Cap company.<BR><BR>History: <BR>Concord Biotech Limited was originally incorporated as Servomed Pharmaceuticals Private Limited in 1984. The company changed its name to Concord Biotech Limited in 2001 when it became a Public Company. The latest quarterly results reported net sales and net profit for June 2026.<BR><BR>Financial Snapshot: <BR>Most recent Net Sales: 257 Cr (Quarterly Results - Jun 2026) <BR>Most recent Net Profit: 59 Cr (Quarterly Results - Jun 2026) <BR>Market-cap value: INR 14,988 Cr (Small Cap)<BR><BR>Key Metrics: <BR>P/E: 55.00 <BR>Industry P/E: 37 <BR>Dividend Yield: 1.26% <BR>Debt-Equity: -0.20 <BR>Return on Equity: 13.06% <BR>Price-to-Book: 7.49 <BR><BR>Contact Details: <BR>Registrar Address: Not available. <BR>Phone: N/A <BR>Email: N/A <BR>Website: N/A

View full answer

Who are the peers of the Concord Biotech?

14-Aug-2026

Concord Biotech's peers include Cohance Life, Natco Pharma, Alivus Life, Alembic Pharma, Shilpa Medicare, Jubilant Pharmo, Marksans Pharma, and Akums Drugs. Marksans Pharma has the highest 1-year return at 64.92%, while Concord Biotech's return is -11.01%.

Peers: The peers of Concord Biotech are Cohance Life, Natco Pharma, Alivus Life, Alembic Pharma, Shilpa Medicare, Jubilant Pharmo, Marksans Pharma, Akums Drugs.<BR><BR>Quality Snapshot: Excellent management risk is observed at Cohance Life, Natco Pharma, Alivus Life, Alembic Pharma, Concord Biotech, and Marksans Pharma, while Average management risk is found at Shilpa Medicare, Jubilant Pharmo, and Akums Drugs. Good growth is noted at Shilpa Medicare, while Below Average growth is seen at Cohance Life, Natco Pharma, Alivus Life, Alembic Pharma, Concord Biotech, Jubilant Pharmo, Marksans Pharma, and Akums Drugs. Excellent capital structure is present at Cohance Life, Natco Pharma, Alivus Life, Alembic Pharma, Concord Biotech, Marksans Pharma, and Akums Drugs, while Below Average capital structure is observed at Shilpa Medicare and Average capital structure at Jubilant Pharmo.<BR><BR>Return Snapshot: The peer with the highest 1-year return is Marksans Pharma at 64.92%, while the lowest is Cohance Life at -54.93%. Concord Biotech's 1-year return is -11.01%, which is higher than Cohance Life's but lower than Marksans Pharma's. Additionally, Jubilant Pharmo is the only peer with a negative six-month return at -2.80%.

View full answer

How big is Concord Biotech?

14-Aug-2026

As of 14th August, Concord Biotech Ltd has a market capitalization of 15,101.87 Cr, with recent net sales of 1,108.40 Cr and a net profit of 275.38 Cr. The company reported shareholder's funds of 2,017.06 Cr and total assets of 2,231.79 Cr for the annual period ending in March 2026.

As of 14th August, Concord Biotech Ltd has a market capitalization of 15,101.87 Cr, categorizing it as a Small Cap company.<BR><BR>In the latest four quarters, Concord Biotech reported Net Sales of 1,108.40 Cr and a Net Profit of 275.38 Cr.<BR><BR>For the latest annual period ending in March 2026, the company had Shareholder's Funds amounting to 2,017.06 Cr and Total Assets of 2,231.79 Cr.

View full answer

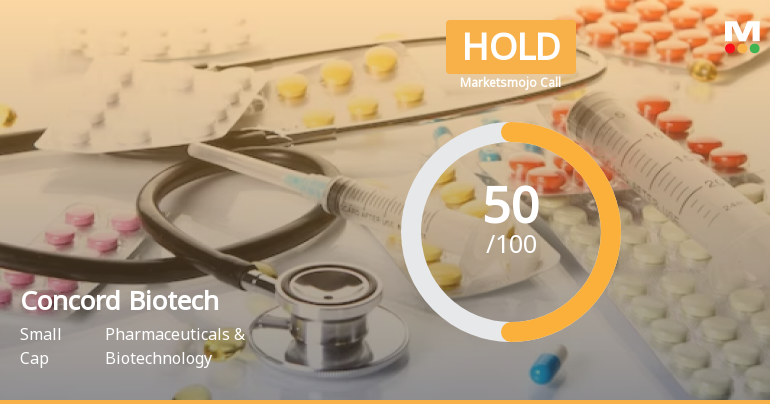
Should I buy, sell or hold Concord Biotech Ltd?

01-Aug-2026

Are Concord Biotech Ltd latest results good or bad?

31-Jul-2026

Concord Biotech Ltd's latest results show a sequential recovery with a 17.39% increase in net sales and a 37.70% rise in net profit quarter-on-quarter. However, year-on-year comparisons reveal a concerning 24.15% decline in net sales and a 36.75% drop in net profit, alongside reduced operating margins, indicating ongoing challenges for the company.

Concord Biotech Ltd's latest results present a mixed picture. On one hand, there was a notable sequential recovery in the fourth quarter of FY26, with net sales increasing by 17.39% compared to the previous quarter, reaching ₹326.08 crores. Additionally, net profit saw a significant quarter-on-quarter increase of 37.70%, amounting to ₹88.79 crores.<BR><BR>However, when looking at year-on-year performance, the results are concerning. Net sales declined by 24.15% compared to the same quarter last year, and net profit fell by 36.75% year-on-year. This decline in profitability is compounded by a significant contraction in operating margins, which decreased to 36.35% from 44.30% in the same quarter last year, indicating increased operational pressures.<BR><BR>Overall, while there are signs of recovery on a sequential basis, the year-on-year declines and margin compression suggest that the company is facing substantial challenges in its operating environment. Investors may need to approach the stock with caution until there are clearer signs of sustained improvement in both sales and profitability.

View full answer

When is the next results date for Concord Biotech Ltd?

29-Jul-2026

The next results date for Concord Biotech Ltd is 31 July 2026.

The next results date for Concord Biotech Ltd is scheduled for 31 July 2026.

View full answer

How has been the historical performance of Concord Biotech?

13-Nov-2025

Concord Biotech has shown consistent growth over the past four years, with net sales increasing from 712.93 Cr in Mar'22 to 1,200.09 Cr in Mar'25, and profit after tax rising from 178.57 Cr to 372.96 Cr. However, cash flow management faced challenges, with a decline in operating cash flow and a net cash outflow in the latest fiscal year.

Answer:<BR>The historical performance of Concord Biotech shows a consistent growth trajectory in key financial metrics over the past four years.<BR><BR>Breakdown:<BR>Concord Biotech's net sales have increased from 712.93 Cr in Mar'22 to 1,200.09 Cr in Mar'25, reflecting a strong upward trend. Total operating income followed a similar pattern, rising from 712.93 Cr to 1,200.09 Cr during the same period. The company's total expenditure, excluding depreciation, also grew from 439.66 Cr in Mar'22 to 693.76 Cr in Mar'25, indicating increased operational costs. Operating profit (PBDIT) saw a significant rise from 296.69 Cr in Mar'22 to 550.78 Cr in Mar'25, showcasing improved profitability. Profit before tax increased from 241.16 Cr to 495.87 Cr, while profit after tax rose from 178.57 Cr to 372.96 Cr, demonstrating effective cost management and revenue generation. The earnings per share (EPS) improved from 16.72 in Mar'22 to 35.53 in Mar'25, reflecting enhanced shareholder value. On the balance sheet, total assets grew from 1,312.79 Cr to 2,034.25 Cr, and total liabilities increased from 1,312.79 Cr to 2,034.25 Cr, indicating a robust growth in the company's financial position. Cash flow from operating activities showed a slight decline from 265.00 Cr in Mar'24 to 244.00 Cr in Mar'25, while net cash outflow was recorded at -14.00 Cr in Mar'25, down from a positive inflow of 11.00 Cr in Mar'24. Overall, Concord Biotech has demonstrated strong growth in sales, profits, and asset base, although cash flow management appears to have faced some challenges in the latest fiscal year.

View full answer

Is Concord Biotech technically bullish or bearish?

08-Oct-2025

As of October 7, 2025, Concord Biotech's trend is mildly bearish due to bearish signals from the MACD and Bollinger Bands, despite some underlying buying pressure indicated by the On-Balance Volume.

As of 7 October 2025, the technical trend has changed from bearish to mildly bearish. The current stance is mildly bearish, driven primarily by the weekly MACD and Bollinger Bands indicating bearish signals. The daily moving averages also reflect a bearish outlook. However, the On-Balance Volume (OBV) shows bullish strength on both weekly and monthly time frames, suggesting some underlying buying pressure. Overall, the lack of strong bullish indicators and the presence of bearish signals in multiple areas indicate a cautious stance on Concord Biotech.

View full answer

Who are the top shareholders of the Concord Biotech?

17-Jul-2025

The top shareholders of Concord Biotech include Sudhir Vaid, who holds 28.84%, followed by 22 mutual funds with 5.16%, 92 foreign institutional investors with 9.35%, and the Aryaman Jhunjhunwala discretionary trust at 8.03%. Individual investors own a total of 6.94% of the company.

The top shareholders of Concord Biotech include the promoters, who hold the majority of the shares. The promoter with the highest holding is Sudhir Vaid, owning 28.84% of the company. Additionally, there are 22 mutual funds that collectively hold 5.16% of the shares, while 92 foreign institutional investors (FIIs) hold 9.35%. The highest public shareholder is the Aryaman Jhunjhunwala discretionary trust, which holds 8.03%. Individual investors collectively own 6.94% of the company.

View full answer

Is Concord Biotech overvalued or undervalued?

09-Jun-2025

As of August 21, 2023, Concord Biotech is considered very expensive and overvalued, with high valuation ratios significantly exceeding its peers, despite a strong 38.84% return over the past year.

As of 21 August 2023, Concord Biotech's valuation grade has moved from does not qualify to very expensive. The company is currently overvalued based on its high valuation ratios, including a PE ratio of 54.06, an EV to EBITDA of 39.12, and a PEG ratio of 2.41. These figures significantly exceed those of its peers, such as Sun Pharmaceutical Industries Ltd. with a PE of 35.25 and Divi's Laboratories Ltd. with an EV to EBITDA of 57.35.<BR><BR>In comparison to its peers, Concord Biotech's financial metrics suggest it is trading at a premium, indicating a lack of justification for its current price. While the company has shown strong returns over the past year, outperforming the Sensex with a 38.84% return compared to the Sensex's 7.53%, the overall valuation still reflects an overvalued status in the current market landscape.

View full answer

Has Concord Biotech declared dividend?

06-Jun-2025

Yes, Concord Biotech Ltd has declared an 875% dividend, amounting to ₹8.75 per share, with an ex-date of June 21, 2024. While the 1-year total return is 33.35%, the recent 6-month return is -10.59%.

Yes, Concord Biotech Ltd has declared a dividend.<BR><BR>Dividend Details:<BR>- Percentage announced: 875%<BR>- Amount per share: 8.75<BR>- Ex-date: Jun-21-2024<BR><BR>Dividend Yield: 0.47%.<BR><BR>Total Returns by Period:<BR>In the 6-month period, the price return was -10.59%, the dividend return was 0%, resulting in a total return of -10.59%.<BR><BR>For the 1-year period, the price return was 32.75%, the dividend return was 0.60%, leading to a total return of 33.35%.<BR><BR>Over the 2-year period, there was no price return or dividend return, resulting in a total return of 0.0%.<BR><BR>In the 3-year period, both the price return and dividend return were 0%, resulting in a total return of 0.0%.<BR><BR>For the 4-year period, there was no price return or dividend return, leading to a total return of 0.0%.<BR><BR>In the 5-year period, the price return was 0% and the dividend return was also 0%, resulting in a total return of 0.0%.<BR><BR>Overall, while Concord Biotech has declared a significant dividend, the total returns over various periods show mixed performance, with a notable positive return in the 1-year period but negative returns in the recent 6-month period.

View full answer
iScoreScore
Click here to find our call on this stock
Strong Sell
Sell
Hold
Buy
Strong Buy

Dashboard

1

High Management Efficiency with a high ROE of 17.91%

 
2

The company is Net-Debt Free

 
3

Poor long term growth as Net Sales has grown by an annual rate of 8.53% and Operating profit at 1.80% over the last 5 years

 
4

Negative results in Jun 26

5

With ROE of 13.1, it has a Very Expensive valuation with a 7.9 Price to Book Value

6

Majority shareholders : Promoters

 
stock-summaryMojo Parameters

Mojo Parameters

Loading Valuation Snapshot...

Stock DNA

stock-summary
Industry

Pharmaceuticals & Biotechnology

stock-summary
Market cap

INR 16,180 Cr (Small Cap)

stock-summary
P/E

57.00

stock-summary
Industry P/E

37

stock-summary
Dividend Yield

1.20%

stock-summary
Debt Equity

-0.20

stock-summary
Return on Equity

13.06%

stock-summary
Price to Book

7.89

Revenue and Profits:
Net Sales:
257 Cr
(Quarterly Results - Jun 2026)
Net Profit:
59 Cr
stock-summaryTotal Returns
Total Returns (Price + Dividend) stock-summary
Dividend Yield (1.2%)
TimePeriod
Price Return
Dividend Return
Total Return
3 Months
39.06%
0.68%
39.74%
6 Months
35.99%
0.67%
36.66%
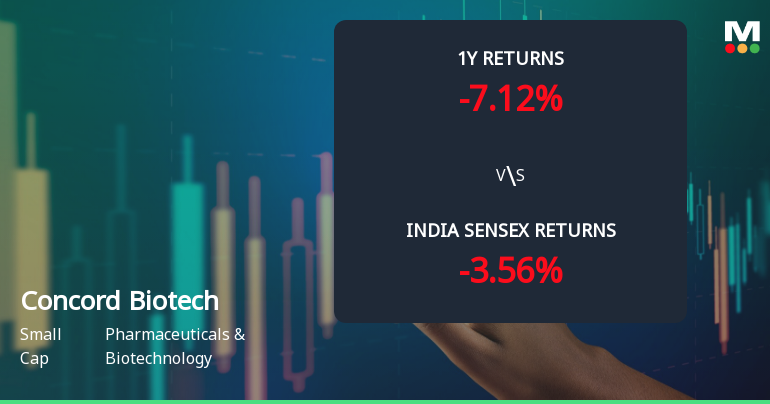
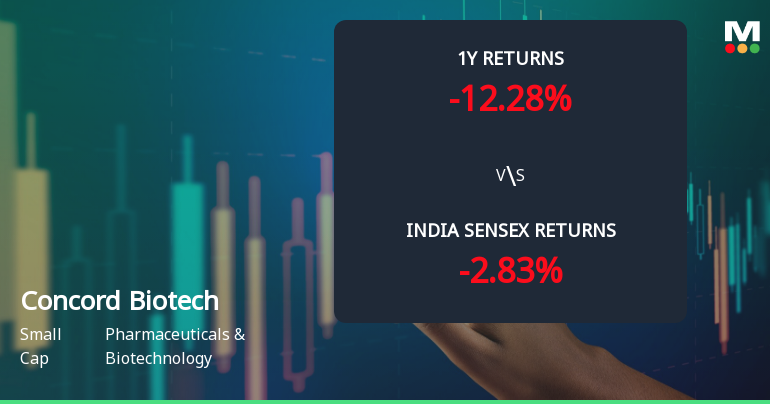
1 Year
-4.3%
1.06%
-3.24%
2 Years
-4.25%
1.13%
-3.12%
3 Years
65.95%
2.78%
68.73%
4 Years
0%
0%
0.0%
5 Years
0%
0%
0.0%

Latest dividend: 7.536419777760013 per share ex-dividend date: Jul-24-2026

Risk Adjusted Returns v/s stock-summary
Returns Beta
Icon
Beta has not been calculated since enough price history is not available
stock-summaryNews & Corporate Actions

Announcements stock-summary

Announcement under Regulation 30 (LODR)-Earnings Call Transcript

07-Aug-2026 | Source : BSE

Transcript of Q1 - FY27 Earnings call held on August 03 2026

Announcement under Regulation 30 (LODR)-Analyst / Investor Meet - Outcome

03-Aug-2026 | Source : BSE

The audio recording of the conference held on August 03 2026 has been hosted on the website of the company and link to access the said recording is as follows: - Link : https://concordbiotech.com/wp-content/uploads/2026/08/Concord-Biotech-Q1-FY27-Earnings-Call-Audio-Recording.mp3

Announcement under Regulation 30 (LODR)-Newspaper Publication

01-Aug-2026 | Source : BSE

Newspaper publication cutouts of unaudited Standalone and Consolidated Financial results for the first quarter ended June 30 2026

Corporate Actions stock-summary

stock-summary
BOARD MEETING

No Upcoming Board Meetings

stock-summary
DIVIDEND

Concord Biotech Ltd has declared 755% dividend, ex-date: 24 Jul 26

stock-summary
SPLITS

No Splits history available

stock-summary
BONUS

No Bonus history available

stock-summary
RIGHTS

No Rights history available

stock-summaryKey Factors

Quality key factors stock-summary

Factor
Value
Sales Growth (5y)
8.53%
EBIT Growth (5y)
1.80%
EBIT to Interest (avg)
100.00
Debt to EBITDA (avg)
Net Debt is too low
Net Debt to Equity (avg)
-0.20
Sales to Capital Employed (avg)
0.64
Tax Ratio
25.09%
Dividend Payout Ratio
24.63%
Pledged Shares
0
Institutional Holding
16.88%
ROCE (avg)
27.54%
ROE (avg)
17.91%

Valuation key factors

Factor
Value
P/E Ratio
57
Industry P/E
37
Price to Book Value
7.89
EV to EBIT
49.42
EV to EBITDA
39.90
EV to Capital Employed
9.66
EV to Sales
13.98
PEG Ratio
NA
Dividend Yield
1.20%
ROCE (Latest)
18.27%
ROE (Latest)
13.06%

Technicals key factors

Indicator
Weekly
Monthly
MACD
Bullish
Mildly Bearish
RSI
No Signal
No Signal
Bollinger Bands
Bullish
Bullish
Moving Averages
Bullish (Daily)
KST
Bearish
Dow Theory
Mildly Bullish
Mildly Bullish
OBV
No Trend
Mildly Bearish
stock-summary Technical Indicator Scale: Bearish, Mildly Bearish, Sideways, Mildly Bullish, Bullish  Turned 
stock-summaryShareholding
Shareholding Snapshot : Jun 2026stock-summary
Shareholding Compare (%holding) stock-summary
Majority shareholders

Promoters

Pledged Promoter Holdings

None

Mutual Funds

Held by 24 Schemes (4.4%)

FIIs

Held by 95 FIIs (7.52%)

Promoter with highest holding

Sudhir Kumar Vaid (28.84%)

Highest Public shareholder

Aryaman Jhunjhunwala Discretionary Trust (8.03%)

Individual Investors Holdings

8.23%

stock-summaryFinancial
[
  {
    "link": "quarterly",
    "btn_text": "All Quarterly Results",
    "header": "Quarterly Results Snapshot (Consolidated) - Jun'26 - QoQ",
    "rhs": [
      {
        "prefix": "Net Sales ",
        "suffix": "QoQ Growth in quarter ended Jun 2026 is -21.03% vs 17.39% in Mar 2026",
        "dir": -1
      },
      {
        "prefix": "Consolidated Net Profit ",
        "suffix": "QoQ Growth in quarter ended Jun 2026 is -34.08% vs 37.70% in Mar 2026",
        "dir": -1
      }
    ],
    "table": {
      "header": [
        "Jun'26",
        "Mar'26",
        "Change(%)"
      ],
      "body": [
        {
          "field": "Net Sales",
          "val1": "257.49",
          "val2": "326.08",
          "chgp": "-21.03%",
          "chgp_class": "negative"
        },
        {
          "field": "Operating Profit (PBDIT) excl Other Income",
          "val1": "82.38",
          "val2": "118.53",
          "chgp": "-30.50%",
          "chgp_class": "negative"
        },
        {
          "field": "Interest",
          "val1": "0.04",
          "val2": "0.08",
          "chgp": "-50.00%",
          "chgp_class": "positive"
        },
        {
          "field": "Exceptional Items",
          "val1": "0.00",
          "val2": "0.00",
          "chgp": "",
          "chgp_class": "neutral"
        },
        {
          "field": "Consolidate Net Profit",
          "val1": "58.53",
          "val2": "88.79",
          "chgp": "-34.08%",
          "chgp_class": "negative"
        },
        {
          "field": "Operating Profit Margin (Excl OI)",
          "val1": "31.99%",
          "val2": "36.35%",
          "chgp": "-4.36%",
          "chgp_class": "negative"
        }
      ]
    }
  },
  {
    "link": "half-yearly",
    "btn_text": "All Half Yearly Results",
    "header": "Half Yearly Results Snapshot (Consolidated) - Sep'25",
    "rhs": [
      {
        "prefix": "Net Sales ",
        "suffix": " Growth in half year ended Sep 2025 is -14.25% vs 15.05% in Sep 2024",
        "dir": -1
      },
      {
        "prefix": "Consolidated Net Profit ",
        "suffix": " Growth in half year ended Sep 2025 is -30.70% vs 14.63% in Sep 2024",
        "dir": -1
      }
    ],
    "table": {
      "header": [
        "Sep'25",
        "Sep'24",
        "Change(%)"
      ],
      "body": [
        {
          "field": "Net Sales",
          "val1": "451.05",
          "val2": "525.98",
          "chgp": "-14.25%",
          "chgp_class": "negative"
        },
        {
          "field": "Operating Profit (PBDIT) excl Other Income",
          "val1": "149.90",
          "val2": "217.95",
          "chgp": "-31.22%",
          "chgp_class": "negative"
        },
        {
          "field": "Interest",
          "val1": "0.12",
          "val2": "0.34",
          "chgp": "-64.71%",
          "chgp_class": "positive"
        },
        {
          "field": "Exceptional Items",
          "val1": "0.00",
          "val2": "0.00",
          "chgp": "",
          "chgp_class": "neutral"
        },
        {
          "field": "Consolidate Net Profit",
          "val1": "107.64",
          "val2": "155.33",
          "chgp": "-30.70%",
          "chgp_class": "negative"
        },
        {
          "field": "Operating Profit Margin (Excl OI)",
          "val1": "33.23%",
          "val2": "41.44%",
          "chgp": "-8.21%",
          "chgp_class": "negative"
        }
      ]
    }
  },
  {
    "link": "nine-monthly",
    "btn_text": "All Nine Monthly Results",
    "header": "Nine Monthly Results Snapshot (Consolidated) - Dec'25",
    "rhs": [
      {
        "prefix": "Net Sales ",
        "suffix": "YoY Growth in nine months ended Dec 2025 is -5.37% vs 10.35% in Dec 2024",
        "dir": -1
      },
      {
        "prefix": "Consolidated Net Profit ",
        "suffix": "YoY Growth in nine months ended Dec 2025 is -25.57% vs 8.53% in Dec 2024",
        "dir": -1
      }
    ],
    "table": {
      "header": [
        "Dec'25",
        "Dec'24",
        "Change(%)"
      ],
      "body": [
        {
          "field": "Net Sales",
          "val1": "728.82",
          "val2": "770.20",
          "chgp": "-5.37%",
          "chgp_class": "negative"
        },
        {
          "field": "Operating Profit (PBDIT) excl Other Income",
          "val1": "248.89",
          "val2": "315.90",
          "chgp": "-21.21%",
          "chgp_class": "negative"
        },
        {
          "field": "Interest",
          "val1": "0.20",
          "val2": "0.44",
          "chgp": "-54.55%",
          "chgp_class": "positive"
        },
        {
          "field": "Exceptional Items",
          "val1": "-3.28",
          "val2": "0.00",
          "chgp": "",
          "chgp_class": "neutral"
        },
        {
          "field": "Consolidate Net Profit",
          "val1": "172.12",
          "val2": "231.25",
          "chgp": "-25.57%",
          "chgp_class": "negative"
        },
        {
          "field": "Operating Profit Margin (Excl OI)",
          "val1": "34.15%",
          "val2": "41.02%",
          "chgp": "-6.87%",
          "chgp_class": "negative"
        }
      ]
    }
  },
  {
    "link": "annual",
    "btn_text": "All Annual Results",
    "header": "Annual Results Snapshot (Consolidated) - Mar'26",
    "rhs": [
      {
        "prefix": "Net Sales ",
        "suffix": "YoY Growth in year ended Mar 2026 is -12.10% vs 18.01% in Mar 2025",
        "dir": -1
      },
      {
        "prefix": "Consolidated Net Profit ",
        "suffix": "YoY Growth in year ended Mar 2026 is -29.79% vs 20.62% in Mar 2025",
        "dir": -1
      }
    ],
    "table": {
      "header": [
        "Mar'26",
        "Mar'25",
        "Change(%)"
      ],
      "body": [
        {
          "field": "Net Sales",
          "val1": "1,054.89",
          "val2": "1,200.09",
          "chgp": "-12.10%",
          "chgp_class": "negative"
        },
        {
          "field": "Operating Profit (PBDIT) excl Other Income",
          "val1": "367.40",
          "val2": "506.33",
          "chgp": "-27.44%",
          "chgp_class": "negative"
        },
        {
          "field": "Interest",
          "val1": "0.28",
          "val2": "0.53",
          "chgp": "-47.17%",
          "chgp_class": "positive"
        },
        {
          "field": "Exceptional Items",
          "val1": "-3.28",
          "val2": "0.00",
          "chgp": "",
          "chgp_class": "neutral"
        },
        {
          "field": "Consolidate Net Profit",
          "val1": "260.91",
          "val2": "371.64",
          "chgp": "-29.79%",
          "chgp_class": "negative"
        },
        {
          "field": "Operating Profit Margin (Excl OI)",
          "val1": "34.83%",
          "val2": "42.19%",
          "chgp": "-7.36%",
          "chgp_class": "negative"
        }
      ]
    }
  }
]

Quarterly Results Snapshot (Consolidated) - Jun'26 - QoQstock-summary

Jun'26
Mar'26
Change(%)
Net Sales
257.49
326.08
-21.03%
Operating Profit (PBDIT) excl Other Income
82.38
118.53
-30.50%
Interest
0.04
0.08
-50.00%
Exceptional Items
0.00
0.00
Consolidate Net Profit
58.53
88.79
-34.08%
Operating Profit Margin (Excl OI)
31.99%
36.35%
-4.36%
Values in Rs Cr.
Direction Arrows
Net Sales

QoQ Growth in quarter ended Jun 2026 is -21.03% vs 17.39% in Mar 2026

Direction Arrows
Consolidated Net Profit

QoQ Growth in quarter ended Jun 2026 is -34.08% vs 37.70% in Mar 2026

Half Yearly Results Snapshot (Consolidated) - Sep'25stock-summary

Sep'25
Sep'24
Change(%)
Net Sales
451.05
525.98
-14.25%
Operating Profit (PBDIT) excl Other Income
149.90
217.95
-31.22%
Interest
0.12
0.34
-64.71%
Exceptional Items
0.00
0.00
Consolidate Net Profit
107.64
155.33
-30.70%
Operating Profit Margin (Excl OI)
33.23%
41.44%
-8.21%
Values in Rs Cr.
Direction Arrows
Net Sales

Growth in half year ended Sep 2025 is -14.25% vs 15.05% in Sep 2024

Direction Arrows
Consolidated Net Profit

Growth in half year ended Sep 2025 is -30.70% vs 14.63% in Sep 2024

Nine Monthly Results Snapshot (Consolidated) - Dec'25stock-summary

Dec'25
Dec'24
Change(%)
Net Sales
728.82
770.20
-5.37%
Operating Profit (PBDIT) excl Other Income
248.89
315.90
-21.21%
Interest
0.20
0.44
-54.55%
Exceptional Items
-3.28
0.00
Consolidate Net Profit
172.12
231.25
-25.57%
Operating Profit Margin (Excl OI)
34.15%
41.02%
-6.87%
Values in Rs Cr.
Direction Arrows
Net Sales

YoY Growth in nine months ended Dec 2025 is -5.37% vs 10.35% in Dec 2024

Direction Arrows
Consolidated Net Profit

YoY Growth in nine months ended Dec 2025 is -25.57% vs 8.53% in Dec 2024

Annual Results Snapshot (Consolidated) - Mar'26stock-summary

Mar'26
Mar'25
Change(%)
Net Sales
1,054.89
1,200.09
-12.10%
Operating Profit (PBDIT) excl Other Income
367.40
506.33
-27.44%
Interest
0.28
0.53
-47.17%
Exceptional Items
-3.28
0.00
Consolidate Net Profit
260.91
371.64
-29.79%
Operating Profit Margin (Excl OI)
34.83%
42.19%
-7.36%
Values in Rs Cr.
Direction Arrows
Net Sales

YoY Growth in year ended Mar 2026 is -12.10% vs 18.01% in Mar 2025

Direction Arrows
Consolidated Net Profit

YoY Growth in year ended Mar 2026 is -29.79% vs 20.62% in Mar 2025

stock-summaryCompany CV
About Concord Biotech Ltd stock-summary
stock-summary
Concord Biotech Ltd
Small Cap
Pharmaceuticals & Biotechnology
Concord Biotech Limited was originally incorporated as `Servomed Pharmaceuticals Private Limited' at Ahmedabad, Gujarat as a Private Limited Company dated November 23, 1984, issued by the Registrar of Companies. Thereafter, name of the Company was changed to `Concord Biotech Limited' dated February 16, 2001, which became a Public Company and a fresh Certificate of Incorporation dated November 7, 2001 was issued by the RoC.
Company Coordinates stock-summary
Icon
No Company Details Available