Motisons Jewel

  • Market Cap: Micro Cap
  • Industry: Gems, Jewellery And Watches
  • ISIN: INE0FRK01020
  • NSEID: MOTISONS
  • BSEID: 544053
INR
16.77
2.12 (14.47%)
BSENSE

Aug 14, 04:01 PM

BSE+NSE Vol: 42.28 cr

  • Price Points
  • Score
  • Mojo Parameters
  • Total Return
  • News and Corporate Actions
  • Key factors
  • Shareholding
  • Financials
  • CompanyCV
stock-summaryPrice Point
High/Low

1Day

52 Week

Valuation
Technical
Day's Volume

CASH

42.28 cr (271.40%) Volume

Shareholding (Jun 2026)

FII

10.57%

Held by 15 FIIs

DII

3.58%

Held by 16 DIIs

Promoter

57.12%

Why is Motisons Jewellers Ltd falling/rising?

16-Aug-2026

As of 15-Aug, Motisons Jewellers Ltd's stock price has risen to Rs 16.77, up 14.47%, driven by strong performance and increased investor interest, including a notable 19.96% surge over the past week. The stock is trading above key moving averages, indicating a strong upward trend and heightened trading activity.

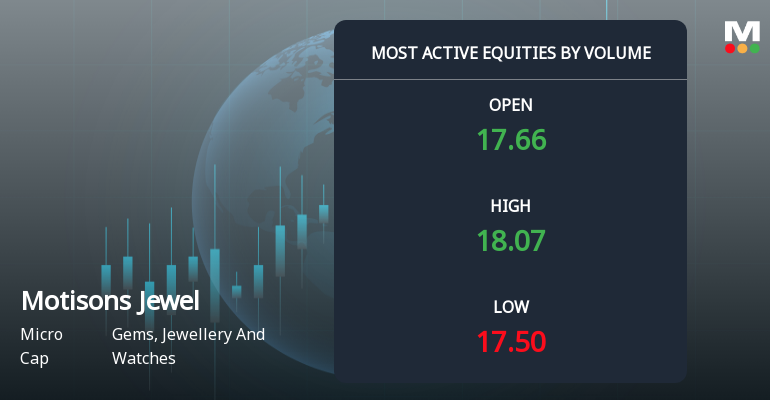
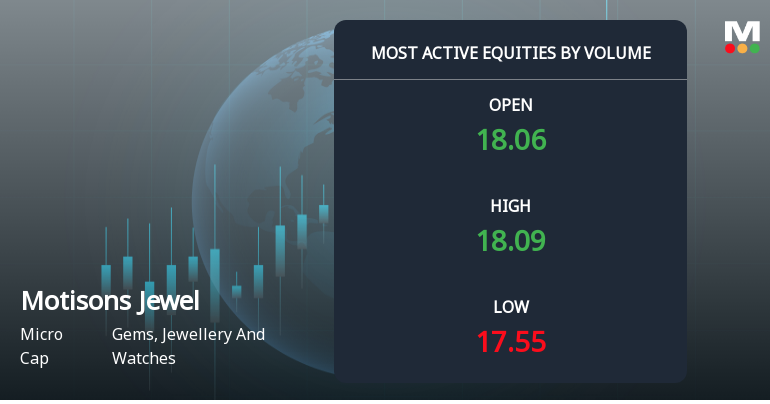
As of 15-Aug, Motisons Jewellers Ltd is experiencing a rise in its stock price, currently at Rs 16.77, reflecting an increase of Rs 2.12 or 14.47%. This upward movement can be attributed to several key factors. Over the past week, the stock has surged by 19.96%, significantly outperforming the Sensex, which has seen a decline of 0.62%. Additionally, the stock has shown a strong performance over the past two days, gaining 23.04% in returns.<BR><BR>Today's trading session has also been notable, with the stock reaching an intraday high of Rs 17.5, marking a rise of 19.45%. The stock has demonstrated high volatility, with an intraday volatility of 7.56%, indicating active trading and investor interest. Furthermore, the stock is trading above its 5-day, 20-day, 50-day, 100-day, and 200-day moving averages, suggesting a strong upward trend.<BR><BR>Investor participation has increased, as evidenced by a delivery volume of 1.4 crore shares on August 13, which is an 86.39% rise compared to the 5-day average. This increase in trading volume indicates growing confidence among investors. Overall, these factors contribute to the rising stock price of Motisons Jewellers Ltd.

View full answer

Should I buy, sell or hold Motisons Jewellers Ltd?

14-Aug-2026

Who are in the management team of Motisons Jewel?

14-Aug-2026

The management team of Motisons Jewel includes Sandeep Chhabra (Chairman), Sanjay Chhabra (Managing Director), Laksh Chhabra (Joint Managing Director), and several independent and non-executive directors, along with Naresh Kumar Sharma as Company Secretary. They are responsible for the company's strategic direction and regulatory compliance.

The management team of Motisons Jewel includes the following key members:<BR><BR>1. **Sandeep Chhabra** - Chairman & Wholetime Director<BR>2. **Sanjay Chhabra** - Managing Director<BR>3. **Laksh Chhabra** - Joint Managing Director<BR>4. **Kajal Chhabra** - Non Executive Director<BR>5. **Namita Chhabra** - Non Executive Director<BR>6. **Jayesh Nemchand Mehta** - Independent Director<BR>7. **Sushil Kumar Gangwal** - Independent Director<BR>8. **Sunil Chordia** - Independent Director<BR>9. **Alpesh Fatehsingh Purohit** - Independent Director<BR>10. **Vikas Kaler** - Independent Director<BR>11. **Naresh Kumar Sharma** - Company Secretary & Compliance Officer<BR><BR>This team plays a crucial role in guiding the company's strategic direction and ensuring compliance with regulations.

View full answer

What does Motisons Jewel do?

14-Aug-2026

Motisons Jewellers Ltd is a Micro Cap company in the Gems, Jewellery, and Watches industry, formed in 1997 and converted to a public company in 2011. As of June 2026, it reported net sales of 107 Cr and a net profit of 11 Cr, with a market cap of INR 1,630 Cr.

Overview: <BR>Motisons Jewellers Ltd operates in the Gems, Jewellery and Watches industry and is categorized as a Micro Cap company.<BR><BR>History: <BR>Motisons Jewellers Ltd was originally formed as a Partnership Firm under the name "M/s. Motisons Jewellers" on October 16, 1997. It converted into a Public Company on May 09, 2011, and received its Certificate of Incorporation on the same date. The latest quarterly results reported net sales and profit for June 2026.<BR><BR>Financial Snapshot: <BR>Net Sales: 107 Cr (Quarterly Results - Jun 2026) <BR>Net Profit: 11 Cr (Quarterly Results - Jun 2026) <BR>Market Cap: INR 1,630 Cr (Micro Cap)<BR><BR>Key Metrics: <BR>P/E: 25.00 <BR>Industry P/E: 52 <BR>Dividend Yield: 0.00% <BR>Debt Equity: 0.05 <BR>Return on Equity: 12.81% <BR>Price to Book: 3.11 <BR><BR>Contact Details: <BR>No Company Details Available <BR>Registrar Address: Not available.

View full answer

Who are the peers of the Motisons Jewel?

14-Aug-2026

Motisons Jewel's peers include Shringar House, Khazanchi Jewell, Shanti Gold, T B Z, Renaiss. Global, Asian Star Co., Radhika Jeweltec, and Utssav CZ Gold. In terms of performance, Khazanchi Jewell leads with a 1-year return of 27.84%, while Motisons Jewel has a return of -19.59%.

Peers: The peers of Motisons Jewel are Shringar House, Khazanchi Jewell, Shanti Gold, T B Z, Renaiss. Global, Asian Star Co., Radhika Jeweltec, and Utssav CZ Gold.<BR><BR>Quality Snapshot: Excellent management risk is observed at Shringar House and Khazanchi Jewell, while Average management risk is found at Shanti Gold, T B Z, Motisons Jewel, Asian Star Co., and Radhika Jeweltec, and the rest. Growth is rated as Excellent for Shringar House, Khazanchi Jewell, and Utssav CZ Gold, Good for T B Z, Average for Radhika Jeweltec, and Below Average for Motisons Jewel, Renaiss. Global, and Asian Star Co. Capital Structure is rated as Excellent for Shringar House, Khazanchi Jewell, and Radhika Jeweltec, Below Average for Shanti Gold and T B Z, Average for Renaiss. Global and Utssav CZ Gold, and Excellent for Motisons Jewel.<BR><BR>Return Snapshot: The peer with the highest 1-year return is Khazanchi Jewell at 27.84%, while the lowest is Radhika Jeweltec at -25.20%. Motisons Jewel's 1-year return is -19.59%, which is higher than Radhika Jeweltec's but lower than Khazanchi Jewell's. Additionally, Renaiss. Global, Asian Star Co., and Radhika Jeweltec have negative six-month returns.

View full answer

How big is Motisons Jewel?

14-Aug-2026

As of 14th August, Motisons Jewellers Ltd has a market capitalization of 1,892.81 Cr, with recent net sales of 509.83 Cr and a net profit of 66.72 Cr.

As of 14th August, Motisons Jewellers Ltd has a market capitalization of 1,892.81 Cr, categorizing it as a Micro Cap company.<BR><BR>In the latest four quarters, the company reported Net Sales of 509.83 Cr and a Net Profit of 66.72 Cr.<BR><BR>The latest annual period for the balance sheet is March 2025, with Shareholder's Funds amounting to 413.52 Cr and Total Assets valued at 507.47 Cr.

View full answer

Are Motisons Jewellers Ltd latest results good or bad?

23-May-2026

Motisons Jewellers Ltd's latest results are concerning, with a 68% decline in net profit quarter-on-quarter and a significant drop in operating margins to 6.11%. Despite a year-on-year revenue increase, the overall performance reflects deteriorating profitability and investor confidence, indicating the results are bad.

Motisons Jewellers Ltd's latest results indicate a challenging situation for the company. In Q4 FY26, the net profit fell significantly to ₹8.30 crore, marking a 68% decline quarter-on-quarter and a 25.47% decrease year-on-year. While the revenue did show a year-on-year increase of 15.76% to ₹137.47 crore, it experienced a sharp 21.25% drop compared to the previous quarter.<BR><BR>The operating margin has also collapsed to 6.11%, which is the lowest in eight quarters, reflecting severe cost pressures. Additionally, the company's reliance on non-operating income, which accounted for nearly half of its profit before tax, raises concerns about the sustainability of its earnings.<BR><BR>Overall, the company's performance has been characterized by deteriorating profitability, a significant decline in margins, and underperformance compared to its sector. The stock has dropped 32.11% over the past year, indicating a loss of investor confidence. Given these factors, the latest results can be viewed as bad, highlighting substantial operational challenges that the company needs to address.

View full answer

When is the next results date for Motisons Jewellers Ltd?

19-May-2026

The next results date for Motisons Jewellers Ltd is 22 May 2026.

The next results date for Motisons Jewellers Ltd is scheduled for 22 May 2026.

View full answer

Is Motisons Jewel technically bullish or bearish?

03-Dec-2025

As of December 2, 2025, Motisons Jewel's technical stance is bearish with moderate strength, driven by bearish MACD, Bollinger Bands, and moving averages, despite a bullish weekly RSI, and significant underperformance compared to the Sensex.

As of 2 December 2025, the technical trend has changed from mildly bearish to bearish. The current technical stance for Motisons Jewel is bearish with moderate strength. Key indicators driving this stance include a bearish MACD on the weekly timeframe, bearish Bollinger Bands on both weekly and monthly timeframes, and bearish moving averages on the daily timeframe. The weekly RSI is bullish, but this is overshadowed by the overall bearish signals from other indicators. Additionally, the stock has shown significant underperformance compared to the Sensex over the year, further supporting the bearish outlook.

View full answer

How has been the historical performance of Motisons Jewel?

01-Dec-2025

Motisons Jewel has shown consistent growth in net sales and profitability from Mar'22 to Mar'25, with net sales increasing from 314.33 Cr to 462.11 Cr and profit after tax rising from 14.75 Cr to 43.17 Cr. However, the company faces challenges with negative cash flow, particularly a significant outflow of 22.00 Cr in Mar'25.

Answer:<BR>The historical performance of Motisons Jewel shows a consistent growth trend in net sales and profitability over the past four years.<BR><BR>Breakdown:<BR>Motisons Jewel's net sales have increased from 314.33 Cr in Mar'22 to 462.11 Cr in Mar'25, reflecting a strong upward trajectory. The total operating income has followed a similar pattern, rising from 314.33 Cr in Mar'22 to 462.11 Cr in Mar'25. However, raw material costs have also increased significantly, from 31.48 Cr in Mar'22 to 61.51 Cr in Mar'25, while the purchase of finished goods peaked at 391.02 Cr in Mar'24 before declining to 341.18 Cr in Mar'25. Operating profit (PBDIT) has shown a positive trend, growing from 38.61 Cr in Mar'22 to 69.16 Cr in Mar'25, with a corresponding increase in profit before tax from 19.99 Cr to 59.40 Cr over the same period. Profit after tax has similarly risen from 14.75 Cr in Mar'22 to 43.17 Cr in Mar'25, indicating improved profitability margins, with the PAT margin increasing from 4.69% to 9.34%. On the balance sheet, total liabilities have grown from 305.80 Cr in Mar'22 to 507.47 Cr in Mar'25, while total assets have also increased from 305.80 Cr to 507.47 Cr, reflecting a healthy balance sheet. Cash flow from operating activities has been negative in recent years, with a notable outflow of 22.00 Cr in Mar'25, contrasting with a net cash inflow of 29.00 Cr in Mar'24. Overall, Motisons Jewel has demonstrated significant growth in sales and profitability, although it faces challenges in cash flow management.

View full answer

Is Motisons Jewel overvalued or undervalued?

19-Nov-2025

As of November 18, 2025, Motisons Jewel is considered very attractive and undervalued with a PE ratio of 29.15, significantly lower than peers like Titan Company and Kalyan Jewellers, and despite a year-to-date return of -39.58%, its strong financial metrics suggest it is a compelling investment opportunity at a price of 16.55.

As of 18 November 2025, the valuation grade for Motisons Jewel has moved from attractive to very attractive, indicating a significant positive shift in its valuation outlook. The company is currently assessed as undervalued. Key ratios supporting this assessment include a PE ratio of 29.15, an EV to EBITDA of 19.97, and a PEG ratio of 0.88, which suggests that the stock is priced favorably relative to its growth potential.<BR><BR>In comparison to peers, Motisons Jewel's PE ratio of 29.15 is considerably lower than Titan Company's PE of 83.5, which is categorized as fair, and Kalyan Jewellers, which is deemed expensive with a PE of 54.4. This positions Motisons Jewel favorably within the industry, especially considering its strong ROCE of 16.93% and ROE of 12.62%. Despite recent stock performance lagging behind the Sensex, with a year-to-date return of -39.58% compared to the Sensex's 8.36%, the underlying valuation metrics suggest that the stock presents a compelling investment opportunity at its current price of 16.55.

View full answer

Who are the top shareholders of the Motisons Jewel?

17-Jul-2025

The top shareholders of Motisons Jewel include Motisons Global Private Limited with 18.57%, individual investors with 25.01%, and Vinod Dugar as the highest public shareholder at 1.27%. Additionally, 12 foreign institutional investors hold a combined 0.16%, with no mutual funds currently invested.

The top shareholders of Motisons Jewel primarily include the promoters, with Motisons Global Private Limited holding the largest stake at 18.57%. Additionally, individual investors collectively own 25.01% of the company. In the public domain, Vinod Dugar is noted as the highest public shareholder with a holding of 1.27%. The company also has 12 foreign institutional investors (FIIs) holding a combined 0.16% of the shares. There are no mutual funds currently invested in Motisons Jewel.

View full answer

Has Motisons Jewel declared dividend?

06-Jun-2025

No Dividend History Available

iScoreScore
Click here to find our call on this stock
Strong Sell
Sell
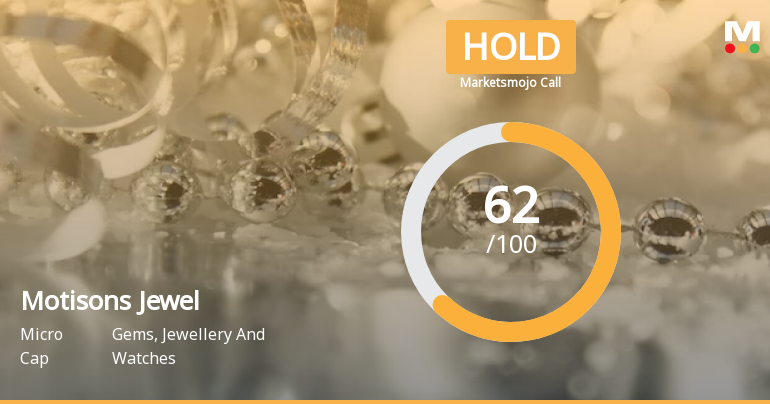
Hold
Buy
Strong Buy

Dashboard

1

Poor long term growth as Net Sales has grown by an annual rate of 10.34% over the last 5 years

 
2

Flat results in Jun 26

3

Underperformed the market in the last 1 year

stock-summaryMojo Parameters

Mojo Parameters

Loading Valuation Snapshot...

Stock DNA

stock-summary
Industry

Gems, Jewellery And Watches

stock-summary
Market cap

INR 1,755 Cr (Micro Cap)

stock-summary
P/E

28.00

stock-summary
Industry P/E

52

stock-summary
Dividend Yield

0.00%

stock-summary
Debt Equity

0.05

stock-summary
Return on Equity

13.41%

stock-summary
Price to Book

3.34

Revenue and Profits:
Net Sales:
107 Cr
(Quarterly Results - Jun 2026)
Net Profit:
11 Cr
stock-summaryTotal Returns
Total Returns (Price + Dividend) stock-summary
Dividend Yield (0%)
TimePeriod
Price Return
Dividend Return
Total Return
3 Months
39.98%
0%
39.98%
6 Months
6.21%
0%
6.21%
1 Year
-8.21%
0%
-8.21%
2 Years
-0.59%
0%
-0.59%
3 Years
0%
0%
0.0%
4 Years
0%
0%
0.0%
5 Years
0%
0%
0.0%

Motisons Jewel for the last several years.

Risk Adjusted Returns v/s stock-summary
Returns Beta
Icon
Beta has not been calculated since enough price history is not available
stock-summaryNews & Corporate Actions

News

Motisons Jewellers Surges 19.96%: 5 Key Events Driving the Rally

Announcements stock-summary

Announcement under Regulation 30 (LODR)-Newspaper Publication

13-Aug-2026 | Source : BSE

Pursuant to the Regulation 47 of SEBI (Listing Obligations and Disclosure Requirements) Regulations 2015 we hereby enclose copy of newspaper advertisement published in Financial Express in English language newspaper and in Business Remedies in Vernacular language newspaper regarding extract of Unaudited Financial Results of the company for the quarter ended 30th June 2026.

Board Meeting Outcome for Outcome Of The Board Meeting Held On 12Th August 2026.

12-Aug-2026 | Source : BSE

Pursuant to the Regulation 30 and 33 of the Securities and Exchange Board of India (Listing Obligations and Disclosure Requirements) Regulations 2015 (the Listing Regulations) as amended from time to time the Board of Directors of the Company at their meeting held today i.e. on Wednesday 12th August 2026 inter-alia considered and approved the Unaudited Financial Results of the Company for the quarter ended 30th June 2026.

Announcement under Regulation 30 (LODR)-Monitoring Agency Report

12-Aug-2026 | Source : BSE

In accordance with Regulation 32(6) of the SEBI (Listing Obligation and Disclosure Requirements) Regulations 2015 and applicable Regulation of the SEBI (Issue of Capital and Disclosure Requirements) Regulations 2018 as amended the Monitoring Agency Report in respect of utilization of proceeds of the Preferential Issue and qualified institutions placements for the Quarter ended June 30th 2026 issued by M/s. CRISIL Ratings Limited Monitoring Agency is enclosed herewith.

Corporate Actions stock-summary

stock-summary
BOARD MEETING

No Upcoming Board Meetings

stock-summary
DIVIDEND

No Dividend history available

stock-summary
SPLITS

Motisons Jewellers Ltd has announced 1:10 stock split, ex-date: 08 Nov 24

stock-summary
BONUS

No Bonus history available

stock-summary
RIGHTS

No Rights history available

stock-summaryKey Factors

Quality key factors stock-summary

Factor
Value
Sales Growth (5y)
10.34%
EBIT Growth (5y)
21.99%
EBIT to Interest (avg)
9.48
Debt to EBITDA (avg)
1.05
Net Debt to Equity (avg)
0.05
Sales to Capital Employed (avg)
0.94
Tax Ratio
25.14%
Dividend Payout Ratio
0
Pledged Shares
0
Institutional Holding
14.15%
ROCE (avg)
15.53%
ROE (avg)
11.62%

Valuation key factors

Factor
Value
P/E Ratio
28
Industry P/E
52
Price to Book Value
3.82
EV to EBIT
21.76
EV to EBITDA
21.32
EV to Capital Employed
3.70
EV to Sales
3.79
PEG Ratio
0.98
Dividend Yield
NA
ROCE (Latest)
16.30%
ROE (Latest)
13.41%

Technicals key factors

Indicator
Weekly
Monthly
MACD
Mildly Bullish
RSI
No Signal
No Signal
Bollinger Bands
Bullish
Sideways
Moving Averages
Mildly Bearish (Daily)
KST
Mildly Bullish
Dow Theory
No Trend
Mildly Bullish
OBV
Mildly Bearish
No Trend
stock-summary Technical Indicator Scale: Bearish, Mildly Bearish, Sideways, Mildly Bullish, Bullish  Turned 
stock-summaryShareholding
Shareholding Snapshot : Jun 2026stock-summary
Shareholding Compare (%holding) stock-summary
Majority shareholders

Promoters

Pledged Promoter Holdings

None

Mutual Funds

Held by 0 Schemes

FIIs

Held by 15 FIIs (10.57%)

Promoter with highest holding

Motisons Global Private Limited (16.07%)

Highest Public shareholder

Umesh Parasmal Pagariya (1.23%)

Individual Investors Holdings

23.33%

stock-summaryFinancial
[
  {
    "link": "quarterly",
    "btn_text": "All Quarterly Results",
    "header": "Quarterly Results Snapshot (Standalone) - Jun'26 - QoQ",
    "rhs": [
      {
        "prefix": "Net Sales ",
        "suffix": "QoQ Growth in quarter ended Jun 2026 is -21.92% vs -21.25% in Mar 2026",
        "dir": -1
      },
      {
        "prefix": "Standalone Net Profit ",
        "suffix": "QoQ Growth in quarter ended Jun 2026 is 33.13% vs -68.00% in Mar 2026",
        "dir": 1
      }
    ],
    "table": {
      "header": [
        "Jun'26",
        "Mar'26",
        "Change(%)"
      ],
      "body": [
        {
          "field": "Net Sales",
          "val1": "107.33",
          "val2": "137.47",
          "chgp": "-21.92%",
          "chgp_class": "negative"
        },
        {
          "field": "Operating Profit (PBDIT) excl Other Income",
          "val1": "16.35",
          "val2": "8.40",
          "chgp": "94.64%",
          "chgp_class": "positive"
        },
        {
          "field": "Interest",
          "val1": "1.08",
          "val2": "2.03",
          "chgp": "-46.80%",
          "chgp_class": "positive"
        },
        {
          "field": "Exceptional Items",
          "val1": "0.00",
          "val2": "-0.30",
          "chgp": "100.00%",
          "chgp_class": "positive"
        },
        {
          "field": "Standalone Net Profit",
          "val1": "11.05",
          "val2": "8.30",
          "chgp": "33.13%",
          "chgp_class": "positive"
        },
        {
          "field": "Operating Profit Margin (Excl OI)",
          "val1": "15.23%",
          "val2": "6.11%",
          "chgp": "9.12%",
          "chgp_class": "positive"
        }
      ]
    }
  },
  {
    "link": "half-yearly",
    "btn_text": "All Half Yearly Results",
    "header": "Half Yearly Results Snapshot (Standalone) - Sep'25",
    "rhs": [
      {
        "prefix": "Net Sales ",
        "suffix": " Growth in half year ended Sep 2025 is -10.37% vs 11.98% in Sep 2024",
        "dir": -1
      },
      {
        "prefix": "Standalone Net Profit ",
        "suffix": " Growth in half year ended Sep 2025 is 76.09% vs 56.94% in Sep 2024",
        "dir": 1
      }
    ],
    "table": {
      "header": [
        "Sep'25",
        "Sep'24",
        "Change(%)"
      ],
      "body": [
        {
          "field": "Net Sales",
          "val1": "177.52",
          "val2": "198.06",
          "chgp": "-10.37%",
          "chgp_class": "negative"
        },
        {
          "field": "Operating Profit (PBDIT) excl Other Income",
          "val1": "43.30",
          "val2": "28.15",
          "chgp": "53.82%",
          "chgp_class": "positive"
        },
        {
          "field": "Interest",
          "val1": "2.82",
          "val2": "4.00",
          "chgp": "-29.50%",
          "chgp_class": "positive"
        },
        {
          "field": "Exceptional Items",
          "val1": "0.00",
          "val2": "0.00",
          "chgp": "",
          "chgp_class": "neutral"
        },
        {
          "field": "Standalone Net Profit",
          "val1": "29.46",
          "val2": "16.73",
          "chgp": "76.09%",
          "chgp_class": "positive"
        },
        {
          "field": "Operating Profit Margin (Excl OI)",
          "val1": "24.39%",
          "val2": "14.21%",
          "chgp": "10.18%",
          "chgp_class": "positive"
        }
      ]
    }
  },
  {
    "link": "nine-monthly",
    "btn_text": "All Nine Monthly Results",
    "header": "Nine Monthly Results Snapshot (Standalone) - Dec'25",
    "rhs": [
      {
        "prefix": "Net Sales ",
        "suffix": "YoY Growth in nine months ended Dec 2025 is 2.54% vs 14.42% in Dec 2024",
        "dir": -1
      },
      {
        "prefix": "Standalone Net Profit ",
        "suffix": "YoY Growth in nine months ended Dec 2025 is 72.96% vs 49.39% in Dec 2024",
        "dir": 1
      }
    ],
    "table": {
      "header": [
        "Dec'25",
        "Dec'24",
        "Change(%)"
      ],
      "body": [
        {
          "field": "Net Sales",
          "val1": "352.08",
          "val2": "343.36",
          "chgp": "2.54%",
          "chgp_class": "positive"
        },
        {
          "field": "Operating Profit (PBDIT) excl Other Income",
          "val1": "78.60",
          "val2": "51.03",
          "chgp": "54.03%",
          "chgp_class": "positive"
        },
        {
          "field": "Interest",
          "val1": "4.01",
          "val2": "5.92",
          "chgp": "-32.26%",
          "chgp_class": "positive"
        },
        {
          "field": "Exceptional Items",
          "val1": "0.00",
          "val2": "0.00",
          "chgp": "",
          "chgp_class": "neutral"
        },
        {
          "field": "Standalone Net Profit",
          "val1": "55.40",
          "val2": "32.03",
          "chgp": "72.96%",
          "chgp_class": "positive"
        },
        {
          "field": "Operating Profit Margin (Excl OI)",
          "val1": "22.32%",
          "val2": "14.86%",
          "chgp": "7.46%",
          "chgp_class": "positive"
        }
      ]
    }
  },
  {
    "link": "annual",
    "btn_text": "All Annual Results",
    "header": "Annual Results Snapshot (Standalone) - Mar'26",
    "rhs": [
      {
        "prefix": "Net Sales ",
        "suffix": "YoY Growth in year ended Mar 2026 is 5.94% vs 10.88% in Mar 2025",
        "dir": -1
      },
      {
        "prefix": "Standalone Net Profit ",
        "suffix": "YoY Growth in year ended Mar 2026 is 47.58% vs 33.94% in Mar 2025",
        "dir": 1
      }
    ],
    "table": {
      "header": [
        "Mar'26",
        "Mar'25",
        "Change(%)"
      ],
      "body": [
        {
          "field": "Net Sales",
          "val1": "489.54",
          "val2": "462.11",
          "chgp": "5.94%",
          "chgp_class": "positive"
        },
        {
          "field": "Operating Profit (PBDIT) excl Other Income",
          "val1": "86.98",
          "val2": "69.46",
          "chgp": "25.22%",
          "chgp_class": "positive"
        },
        {
          "field": "Interest",
          "val1": "6.04",
          "val2": "8.80",
          "chgp": "-31.36%",
          "chgp_class": "positive"
        },
        {
          "field": "Exceptional Items",
          "val1": "-0.30",
          "val2": "0.00",
          "chgp": "",
          "chgp_class": "neutral"
        },
        {
          "field": "Standalone Net Profit",
          "val1": "63.71",
          "val2": "43.17",
          "chgp": "47.58%",
          "chgp_class": "positive"
        },
        {
          "field": "Operating Profit Margin (Excl OI)",
          "val1": "17.77%",
          "val2": "15.03%",
          "chgp": "2.74%",
          "chgp_class": "positive"
        }
      ]
    }
  }
]

Quarterly Results Snapshot (Standalone) - Jun'26 - QoQstock-summary

Jun'26
Mar'26
Change(%)
Net Sales
107.33
137.47
-21.92%
Operating Profit (PBDIT) excl Other Income
16.35
8.40
94.64%
Interest
1.08
2.03
-46.80%
Exceptional Items
0.00
-0.30
100.00%
Standalone Net Profit
11.05
8.30
33.13%
Operating Profit Margin (Excl OI)
15.23%
6.11%
9.12%
Values in Rs Cr.
Direction Arrows
Net Sales

QoQ Growth in quarter ended Jun 2026 is -21.92% vs -21.25% in Mar 2026

Direction Arrows
Standalone Net Profit

QoQ Growth in quarter ended Jun 2026 is 33.13% vs -68.00% in Mar 2026

Half Yearly Results Snapshot (Standalone) - Sep'25stock-summary

Sep'25
Sep'24
Change(%)
Net Sales
177.52
198.06
-10.37%
Operating Profit (PBDIT) excl Other Income
43.30
28.15
53.82%
Interest
2.82
4.00
-29.50%
Exceptional Items
0.00
0.00
Standalone Net Profit
29.46
16.73
76.09%
Operating Profit Margin (Excl OI)
24.39%
14.21%
10.18%
Values in Rs Cr.
Direction Arrows
Net Sales

Growth in half year ended Sep 2025 is -10.37% vs 11.98% in Sep 2024

Direction Arrows
Standalone Net Profit

Growth in half year ended Sep 2025 is 76.09% vs 56.94% in Sep 2024

Nine Monthly Results Snapshot (Standalone) - Dec'25stock-summary

Dec'25
Dec'24
Change(%)
Net Sales
352.08
343.36
2.54%
Operating Profit (PBDIT) excl Other Income
78.60
51.03
54.03%
Interest
4.01
5.92
-32.26%
Exceptional Items
0.00
0.00
Standalone Net Profit
55.40
32.03
72.96%
Operating Profit Margin (Excl OI)
22.32%
14.86%
7.46%
Values in Rs Cr.
Direction Arrows
Net Sales

YoY Growth in nine months ended Dec 2025 is 2.54% vs 14.42% in Dec 2024

Direction Arrows
Standalone Net Profit

YoY Growth in nine months ended Dec 2025 is 72.96% vs 49.39% in Dec 2024

Annual Results Snapshot (Standalone) - Mar'26stock-summary

Mar'26
Mar'25
Change(%)
Net Sales
489.54
462.11
5.94%
Operating Profit (PBDIT) excl Other Income
86.98
69.46
25.22%
Interest
6.04
8.80
-31.36%
Exceptional Items
-0.30
0.00
Standalone Net Profit
63.71
43.17
47.58%
Operating Profit Margin (Excl OI)
17.77%
15.03%
2.74%
Values in Rs Cr.
Direction Arrows
Net Sales

YoY Growth in year ended Mar 2026 is 5.94% vs 10.88% in Mar 2025

Direction Arrows
Standalone Net Profit

YoY Growth in year ended Mar 2026 is 47.58% vs 33.94% in Mar 2025

stock-summaryCompany CV
About Motisons Jewellers Ltd stock-summary
stock-summary
Motisons Jewellers Ltd
Micro Cap
Gems, Jewellery And Watches
Motisons Jewellers Limited was originally formed as Partnership Firm under the name "M/s. Motisons Jewellers", pursuant to a Partnership Deed dated October 16,1997. "M/s Motisons Jewellers" thereafter converted into a Public Company as "Motisons Jewellers Limited" on May 09, 2011 and was granted a Certificate of Incorporation dated May 09, 2011 issued by the ROC, Jaipur.
Company Coordinates stock-summary
Icon
No Company Details Available