
Compare Rashi Peripheral with Similar Stocks
Dashboard
Healthy long term growth as Operating profit has grown by an annual rate 26.32%
With a growth in Net Profit of 16.42%, the company declared Very Positive results in Mar 26
With ROCE of 14.9, it has a Attractive valuation with a 2.1 Enterprise value to Capital Employed
Company is among the highest 1% of companies rated by MarketsMojo across all 4,000 stocks
Market Beating Performance
Stock DNA
IT - Hardware
INR 5,298 Cr (Small Cap)
19.00
23
0.25%
0.45
13.71%
2.56
Total Returns (Price + Dividend) 
Latest dividend: 1.9885734690233885 per share ex-dividend date: Aug-11-2025
Risk Adjusted Returns v/s
Returns Beta

News
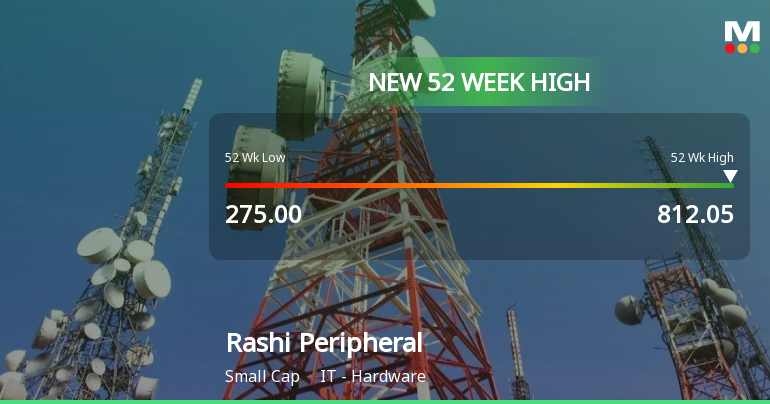
Broad-Based Technical Strength Lifts Rashi Peripherals Ltd to 52-Week High of Rs 812.05
Surging past its previous peaks, Rashi Peripherals Ltd touched a new 52-week high of Rs 812.05 on 2 Jul 2026, marking a remarkable rally from its 52-week low of Rs 275. This milestone reflects a sustained momentum driven by a confluence of technical indicators and robust price action.
Read full news article
Rashi Peripherals Ltd Hits All-Time High of Rs 809 as Momentum Builds Across Timeframes
Extending its winning streak to four sessions, Rashi Peripherals Ltd surged 2.66% on 2 Jul 2026 to close at Rs 809, marking a fresh all-time high. This milestone caps a remarkable rally that has seen the stock outperform the Sensex by a wide margin over multiple timeframes.
Read full news article
Rashi Peripherals Ltd Downgraded to 'Buy' Amid Mixed Technical and Valuation Signals
Rashi Peripherals Ltd, a prominent player in the IT hardware sector, has seen its investment rating downgraded from Strong Buy to Buy as of 1 July 2026. This adjustment reflects nuanced changes across four critical parameters: quality, valuation, financial trend, and technical indicators. Despite the downgrade, the company continues to demonstrate robust fundamentals and market-beating returns, warranting close attention from investors.
Read full news article Announcements
Closure of Trading Window
26-Jun-2026 | Source : BSEWe submit herewith intimation regarding closure of trading window with effect from July 1 2026.
Board Meeting Outcome for Board Approves The Acquisition Of Company - VDA Infosolutions Private Limited
23-Jun-2026 | Source : BSEBoard of Directors have approved inter-alia acquisition of VDA Infosolutions Private Limited and reappointment of Statutory Auditors for a second tenure of Five years
Announcement under Regulation 30 (LODR)-Acquisition
23-Jun-2026 | Source : BSECompany has decided to acquire the company - VDA Infosolutions Private Limited as per attached details
Corporate Actions

No Upcoming Board Meetings

Rashi Peripherals Ltd has declared 40% dividend, ex-date: 11 Aug 25

No Splits history available

No Bonus history available

No Rights history available
Quality key factors
Valuation key factors
Technicals key factors
 Technical Indicator Scale: Bearish, Mildly Bearish, Sideways, Mildly Bullish, Bullish Turned
 Shareholding Snapshot : Mar 2026
Shareholding Compare (%holding)
Promoters
None
Held by 1 Schemes (7.58%)
Held by 22 FIIs (0.78%)
Mkc Family Trust (richa Vohra, Rashi Choudhary) (11.22%)
Bandhan Small Cap Fund (7.58%)
13.96%
Quarterly Results Snapshot (Consolidated) - Mar'26 - QoQ

QoQ Growth in quarter ended Mar 2026 is 11.39% vs -3.01% in Dec 2025

QoQ Growth in quarter ended Mar 2026 is 14.49% vs 25.71% in Dec 2025
Half Yearly Results Snapshot (Consolidated) - Sep'25
Growth in half year ended Sep 2025 is -8.35% vs 45.80% in Sep 2024
Growth in half year ended Sep 2025 is -4.10% vs 63.94% in Sep 2024
Nine Monthly Results Snapshot (Consolidated) - Dec'25
YoY Growth in nine months ended Dec 2025 is 4.99% vs 33.45% in Dec 2024
YoY Growth in nine months ended Dec 2025 is 23.34% vs 54.57% in Dec 2024
Annual Results Snapshot (Consolidated) - Mar'26
YoY Growth in year ended Mar 2026 is 14.92% vs 24.14% in Mar 2025
YoY Growth in year ended Mar 2026 is 33.41% vs 47.33% in Mar 2025
About Rashi Peripherals Ltd

Company Coordinates


