
Compare Afcom Holdings with Similar Stocks
Dashboard
High Management Efficiency with a high ROCE of 23.48%
Strong ability to service debt as the company has a low Debt to EBITDA ratio of 1.72 times
Healthy long term growth as Net Sales has grown by an annual rate of 86.40% and Operating profit at 108.87%
With a growth in Net Profit of 29.64%, the company declared Very Positive results in Mar 26
Market Beating Performance
Stock DNA
Transport Services
INR 3,557 Cr (Small Cap)
26.00
37
0.00%
0.74
26.69%
7.78
Total Returns (Price + Dividend) 
Afcom Holdings for the last several years.
Risk Adjusted Returns v/s
Returns Beta

News
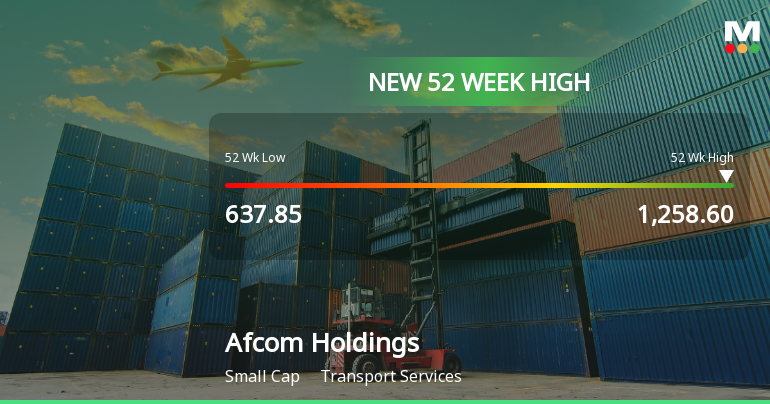
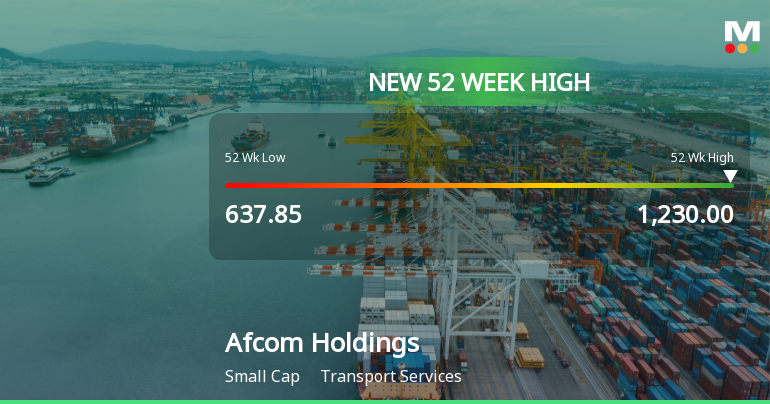
Broad-Based Technical Strength Lifts Afcom Holdings Ltd to 52-Week High of Rs 1230
With a decisive break above Rs 1230 on 25 Jun 2026, Afcom Holdings Ltd has reached a new 52-week high, extending its impressive rally that has delivered 37.04% returns over the past year, comfortably outperforming the Sensex’s decline of 6.33% in the same period.
Read full news article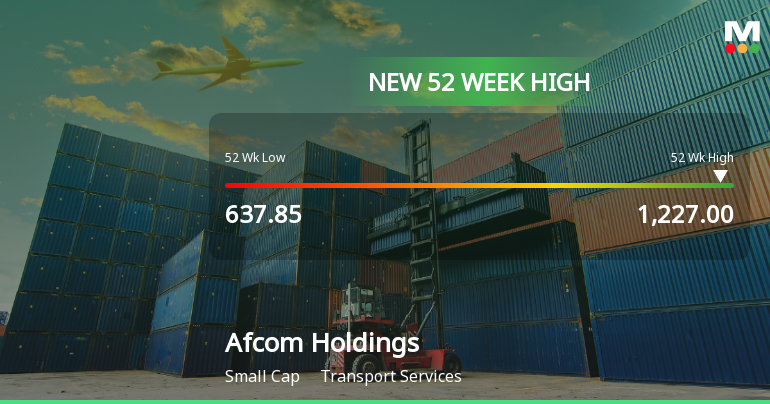
Broad-Based Technical Strength Lifts Afcom Holdings Ltd to 52-Week High of Rs 1227
With a decisive break above Rs 1227 on 24 Jun 2026, Afcom Holdings Ltd has reached a fresh 52-week high, extending its impressive 41.78% annual return well beyond the broader market’s subdued performance. This milestone is underpinned by a confluence of robust technical indicators and sustained price momentum that have propelled the stock through multiple resistance levels.
Read full news article Announcements
Announcement under Regulation 30 (LODR)-Earnings Call Transcript
17-Jun-2026 | Source : BSEPursuant to Regulation 30 of SEBI (Listing Obligations and Disclosure Requirements) Regulations 2015 please find enclosed the transcript of the earnings call held on June 12 2026.
Announcement under Regulation 30 (LODR)-Analyst / Investor Meet - Outcome
13-Jun-2026 | Source : BSEOutcome - Video recording
Announcement under Regulation 30 (LODR)-Investor Presentation
12-Jun-2026 | Source : BSEInvestor Presentation to be presented at the Investor Call on June 12 2026
Corporate Actions

No Upcoming Board Meetings

No Dividend history available

No Splits history available

No Bonus history available

No Rights history available
Quality key factors
Valuation key factors
Technicals key factors
 Technical Indicator Scale: Bearish, Mildly Bearish, Sideways, Mildly Bullish, Bullish Turned
 Shareholding Snapshot : May 2026
Shareholding Compare (%holding)
Non Institution
None
Held by 1 Schemes (2.06%)
Held by 4 FIIs (1.02%)
Deepak Parasuraman (15.37%)
Ritu Bapna (2.22%)
41.21%
Quarterly Results Snapshot (Standalone) - Mar'26 - QoQ

QoQ Growth in quarter ended Mar 2026 is 24.74% vs 25.69% in Dec 2025

QoQ Growth in quarter ended Mar 2026 is 29.64% vs 21.35% in Dec 2025
Half Yearly Results Snapshot (Standalone) - Sep'25
Growth in half year ended Sep 2025 is 60.23% vs 68.95% in Mar 2025
Growth in half year ended Sep 2025 is 85.97% vs 56.79% in Mar 2025
Nine Monthly Results Snapshot (Standalone) - Dec'25
YoY Growth in nine months ended Dec 2025 is 40.76% vs 6.82% in Mar 2026
YoY Growth in nine months ended Dec 2025 is 40.81% vs 11.73% in Mar 2026
Annual Results Snapshot (Standalone) - Mar'26
YoY Growth in year ended Mar 2026 is 144.27% vs 61.79% in Mar 2025
YoY Growth in year ended Mar 2026 is 229.99% vs 45.20% in Mar 2025
About Afcom Holdings Ltd

Company Coordinates


