
Compare Allcargo Logist. with Similar Stocks
Stock DNA
Transport Services
INR 1,194 Cr (Micro Cap)
74.00
63
0.00%
0.98
2.79%
2.06
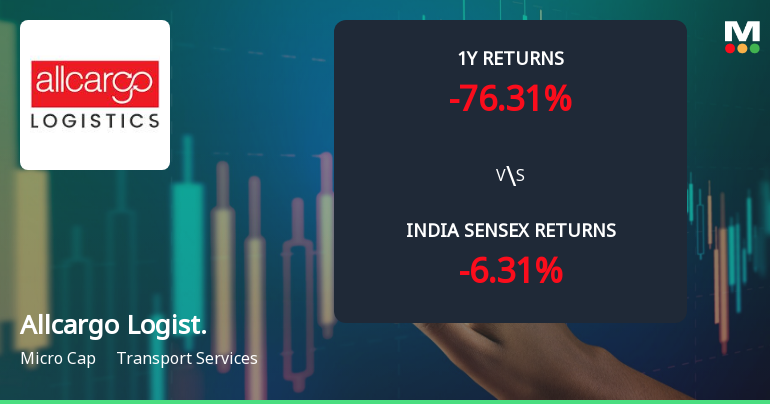
Total Returns (Price + Dividend) 
Latest dividend: 1.1 per share ex-dividend date: Oct-25-2024
Risk Adjusted Returns v/s
Returns Beta

News
Allcargo Logistics Ltd Faces Bearish Momentum Amid Technical Downturn
Allcargo Logistics Ltd (NSE: 968239), a micro-cap player in the transport services sector, has experienced a notable shift in its technical momentum, moving from a mildly bearish to a more pronounced bearish trend. Despite some mildly bullish weekly signals, the overall technical indicators suggest increasing downward pressure on the stock, which has seen its price decline by 1.47% today to ₹8.03, closing below its previous close of ₹8.15.
Read full news article
Allcargo Logistics Ltd Technical Momentum Shifts Amid Prolonged Downtrend
Allcargo Logistics Ltd has experienced a subtle shift in its technical momentum, moving from a strongly bearish stance to a mildly bearish trend, as reflected in recent technical indicators. Despite this slight improvement, the stock continues to face significant downward pressure, with key metrics signalling caution for investors amid a challenging market backdrop.
Read full news article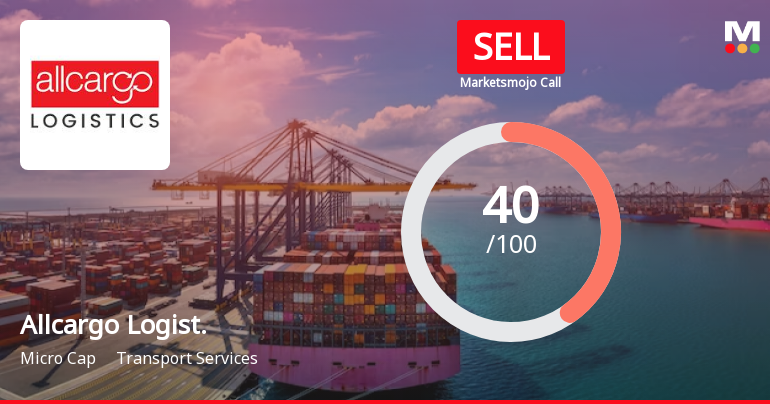
Allcargo Logistics Ltd is Rated Sell
Allcargo Logistics Ltd is rated 'Sell' by MarketsMOJO, with this rating last updated on 01 April 2026. However, the analysis and financial metrics discussed here reflect the stock's current position as of 01 July 2026, providing investors with the latest insights into the company’s performance and outlook.
Read full news article Announcements
Allcargo Logistics Limited - Analysts/Institutional Investor Meet/Con. Call Updates
09-Dec-2019 | Source : NSEAllcargo Logistics Limited has informed the Exchange regarding Analysts/Institutional Investor Meet/Con. Call Updates scheduled to be held on December 11, 2019. For further details refer attachment.
Allcargo Logistics Limited - Other General Purpose
05-Dec-2019 | Source : NSEAllcargo Logistics Limited has informed the Exchange regarding Disclosure of Related party Transactions under Regulation 23(9) of the SEBI ( LODR) Regulations, 2015.
Allcargo Logistics Limited - Trading Window
03-Dec-2019 | Source : NSEAllcargo Logistics Limited has informed the Exchange regarding the Trading Window closure pursuant to SEBI (Prohibition of Insider Trading) Regulations, 2015
Corporate Actions

No Upcoming Board Meetings

Allcargo Logistics Ltd has declared 55% dividend, ex-date: 25 Oct 24

Allcargo Logistics Ltd has announced 2:10 stock split, ex-date: 19 Nov 09

Allcargo Logistics Ltd has announced 3:1 bonus issue, ex-date: 02 Jan 24

No Rights history available
Quality key factors
Valuation key factors
Technicals key factors
 Technical Indicator Scale: Bearish, Mildly Bearish, Sideways, Mildly Bullish, Bullish Turned
 Shareholding Snapshot : Mar 2026
Shareholding Compare (%holding)
Non Institution
None
Held by 3 Schemes (1.2%)
Held by 72 FIIs (7.27%)
Shashi Kiran Shetty (34.41%)
Mukul Mahavir Agrawal (2.94%)
40.16%
Quarterly Results Snapshot (Consolidated) - Mar'26 - QoQ

QoQ Growth in quarter ended Mar 2026 is -0.39% vs -3.91% in Dec 2025
QoQ Growth in quarter ended Mar 2026 is 900.00% vs -77.78% in Dec 2025
Half Yearly Results Snapshot (Consolidated) - Sep'25
Growth in half year ended Sep 2025 is 10.54% vs -85.86% in Sep 2024

Growth in half year ended Sep 2025 is -533.33% vs -97.92% in Sep 2024
Nine Monthly Results Snapshot (Consolidated) - Dec'25
YoY Growth in nine months ended Dec 2025 is 6.56% vs -85.20% in Dec 2024
YoY Growth in nine months ended Dec 2025 is -266.67% vs -101.93% in Dec 2024
Annual Results Snapshot (Consolidated) - Mar'26
YoY Growth in year ended Mar 2026 is 4.95% vs -84.88% in Mar 2025
YoY Growth in year ended Mar 2026 is -87.69% vs -56.58% in Mar 2025
About Allcargo Logistics Ltd

Company Coordinates


