
Compare Carraro India with Similar Stocks
Dashboard
High Management Efficiency with a high ROCE of 24.57%
Strong ability to service debt as the company has a low Debt to EBITDA ratio of 1.02 times
Healthy long term growth as Operating profit has grown by an annual rate 50.60%
With a growth in Net Profit of 48.52%, the company declared Very Positive results in Mar 26
With ROCE of 27.5, it has a Attractive valuation with a 5.1 Enterprise value to Capital Employed
Stock DNA
Auto Components & Equipments
INR 3,230 Cr (Small Cap)
23.00
37
0.79%
0.11
24.40%
5.76
Total Returns (Price + Dividend) 
Latest dividend: 4.5 per share ex-dividend date: Sep-03-2025
Risk Adjusted Returns v/s
Returns Beta

News

Carraro India Ltd Downgraded to Buy Amid Technical Softening Despite Strong Fundamentals
Carraro India Ltd, a small-cap player in the auto components sector, has seen its investment rating downgraded from Strong Buy to Buy as of 25 June 2026. This adjustment primarily reflects a shift in technical indicators, while the company’s fundamental and financial metrics continue to demonstrate robust growth and operational efficiency.
Read full news article
Carraro India Ltd Upgraded to Strong Buy on Robust Financials and Bullish Technicals
Carraro India Ltd, a small-cap player in the Auto Components & Equipments sector, has been upgraded from a Buy to a Strong Buy rating by MarketsMOJO as of 19 June 2026. This upgrade reflects significant improvements across four key parameters: Quality, Valuation, Financial Trend, and Technicals, underpinned by the company’s impressive quarterly results and positive market momentum.
Read full news article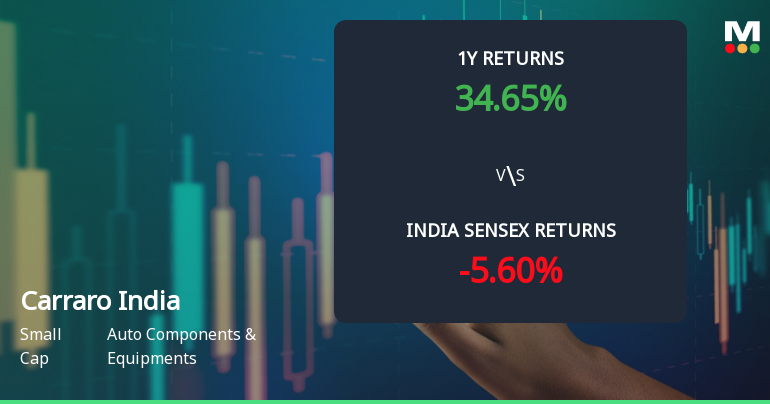
Carraro India Ltd Technical Momentum Shifts Signal Bullish Outlook
Shares of Carraro India Ltd have exhibited a notable shift in technical momentum, moving from a mildly bullish stance to a more confident bullish trend. This transition is underscored by a combination of moving averages, Bollinger Bands, and momentum oscillators, signalling renewed investor interest and potential upside in the auto components sector.
Read full news article Announcements
Closure of Trading Window
23-Jun-2026 | Source : BSECarraro India Limited has informed the Exchange about intimation of closure of trading window.
Announcement under Regulation 30 (LODR)-Change in Management
19-Jun-2026 | Source : BSECarraro India Limited has informed the Exchange about resignation of Mr. Vijay Raman Director of Purchase & Supply Chain Management designated as Senior Management Personnel (SMP) with effect of the close of business hours on 19th June 2026
Announcement under Regulation 30 (LODR)-Earnings Call Transcript
02-Jun-2026 | Source : BSECarraro India Limited has informed the Exchange about transcript of earnings conference call held on Wednesday 27th May 2026
Corporate Actions

No Upcoming Board Meetings

Carraro India Ltd has declared 45% dividend, ex-date: 03 Sep 25

No Splits history available

No Bonus history available

No Rights history available
Quality key factors
Valuation key factors
Technicals key factors
 Technical Indicator Scale: Bearish, Mildly Bearish, Sideways, Mildly Bullish, Bullish Turned
 Shareholding Snapshot : Mar 2026
Shareholding Compare (%holding)
Promoters
None
Held by 10 Schemes (11.29%)
Held by 17 FIIs (3.01%)
Carraro International S.e. (68.77%)
Hsbc Mutual Fund - Hsbc Small Cap Fund (2.79%)
9.26%
Quarterly Results Snapshot (Consolidated) - Mar'26 - QoQ

QoQ Growth in quarter ended Mar 2026 is 6.52% vs -2.84% in Dec 2025
QoQ Growth in quarter ended Mar 2026 is 48.54% vs -11.48% in Dec 2025
Half Yearly Results Snapshot (Consolidated) - Sep'25
Growth in half year ended Sep 2025 is 17.99% vs -4.83% in Sep 2024

Growth in half year ended Sep 2025 is 22.28% vs 99.48% in Sep 2024
Nine Monthly Results Snapshot (Consolidated) - Dec'25
YoY Growth in nine months ended Dec 2025 is 20.94% vs -13.04% in Dec 2024
YoY Growth in nine months ended Dec 2025 is 38.00% vs -3.32% in Dec 2024
Annual Results Snapshot (Consolidated) - Mar'26
YoY Growth in year ended Mar 2026 is 24.78% vs 1.04% in Mar 2025
YoY Growth in year ended Mar 2026 is 48.16% vs 40.90% in Mar 2025
About Carraro India Ltd

Company Coordinates


