
Compare Advance Agrolife with Similar Stocks
Stock DNA
Pesticides & Agrochemicals
INR 621 Cr (Micro Cap)
19.00
29
0.00%
0.07
11.38%
2.00
Total Returns (Price + Dividend) 
Advance Agrolife for the last several years.
Risk Adjusted Returns v/s
Returns Beta

News

Advance Agrolife Ltd is Rated Hold by MarketsMOJO
Advance Agrolife Ltd is rated 'Hold' by MarketsMOJO, with this rating last updated on 15 June 2026. However, the analysis and financial metrics discussed here reflect the stock's current position as of 21 June 2026, providing investors with an up-to-date view of the company’s fundamentals, valuation, financial trends, and technical outlook.
Read full news article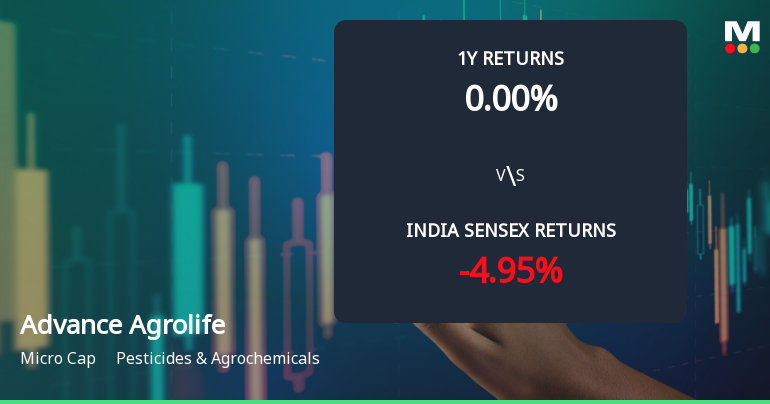
Advance Agrolife Ltd Technical Momentum Shifts Amid Mixed Market Returns
Advance Agrolife Ltd, a micro-cap player in the Pesticides & Agrochemicals sector, has experienced a notable shift in its technical momentum, moving from a sideways trend to a mildly bearish stance. This change comes amid a backdrop of underwhelming year-to-date returns and a recent upgrade in its MarketsMOJO grade from Sell to Hold, signalling cautious optimism despite prevailing headwinds.
Read full news article
Advance Agrolife Ltd is Rated Sell
Advance Agrolife Ltd is rated Sell by MarketsMOJO, with this rating last updated on 08 June 2026. However, the analysis and financial metrics discussed here reflect the stock's current position as of 10 June 2026, providing investors with the most up-to-date view of the company’s fundamentals, returns, and market standing.
Read full news article Announcements
Announcement under Regulation 30 (LODR)-Analyst / Investor Meet - Intimation
10-Jun-2026 | Source : BSEIntimation of Schedule of Investors / Analysts meet Choice Institutional Equities - Insight X 2026
Compliances-Reg.24(A)-Annual Secretarial Compliance
28-May-2026 | Source : BSEAnnual Secretarial Compliance Report for the financial year ended March 31 2026
Announcement under Regulation 30 (LODR)-Newspaper Publication
09-May-2026 | Source : BSENewspaper Publication for the Audited Financial Results for the Quarter and Year ended March 31 2026
Corporate Actions

No Upcoming Board Meetings

No Dividend history available

No Splits history available

No Bonus history available

No Rights history available
Quality key factors
Valuation key factors
Technicals key factors
 Technical Indicator Scale: Bearish, Mildly Bearish, Sideways, Mildly Bullish, Bullish Turned
 Shareholding Snapshot : Mar 2026
Shareholding Compare (%holding)
Promoters
None
Held by 0 Schemes
Held by 11 FIIs (2.58%)
Om Prakash Choudhary (37.92%)
Radiant Computech Private Limited (1.57%)
12.58%
Quarterly Results Snapshot (Standalone) - Mar'26 - QoQ

QoQ Growth in quarter ended Mar 2026 is -6.60% vs -37.62% in Dec 2025
QoQ Growth in quarter ended Mar 2026 is 147.84% vs -81.05% in Dec 2025
Half Yearly Results Snapshot (Standalone) - Sep'25
Not Applicable: The company has declared_date for only one period
Not Applicable: The company has declared_date for only one period
Nine Monthly Results Snapshot (Standalone) - Dec'25
Not Applicable: The company has declared_date for only one period
Not Applicable: The company has declared_date for only one period
Annual Results Snapshot (Standalone) - Mar'26
YoY Growth in year ended Mar 2026 is 26.98% vs 10.17% in Mar 2025
YoY Growth in year ended Mar 2026 is 37.60% vs 3.68% in Mar 2025
About Advance Agrolife Ltd

Company Coordinates


