
Compare Pun. & Sind Bank with Similar Stocks
Dashboard
Despite the size of the company, domestic mutual funds hold only 1.86% of the company
- Domestic mutual funds have capability to do in-depth on-the-ground research on companies- their small stake may signify either they are not comfortable at the price or the business
Underperformed the market in the last 1 year
Total Returns (Price + Dividend) 
Latest dividend: 0 per share ex-dividend date: Jul-29-2025
Risk Adjusted Returns v/s
Returns Beta

News

Punjab & Sind Bank Downgraded to Sell Amid Mixed Financial Signals and Valuation Shifts
Punjab & Sind Bank’s investment rating has been downgraded from Hold to Sell as of 1 July 2026, reflecting a nuanced reassessment across valuation, quality, financial trends, and technical parameters. Despite some positive financial results and attractive valuation metrics, concerns over market underperformance and limited institutional interest have weighed heavily on the outlook.
Read full news article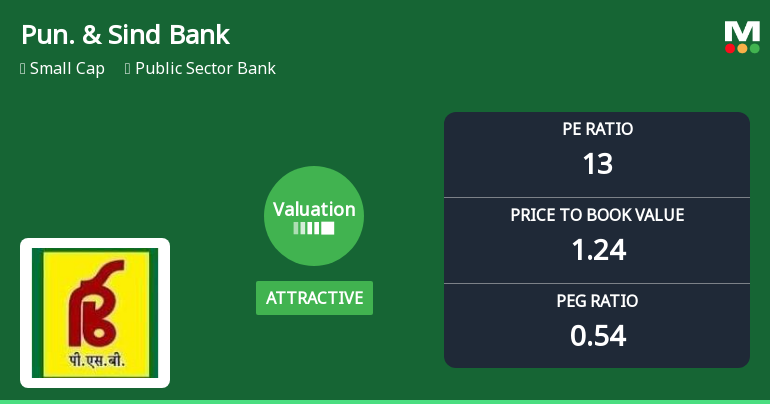
Punjab & Sind Bank Valuation Shifts Signal Renewed Price Attractiveness Amid Sector Challenges
Punjab & Sind Bank’s valuation metrics have recently undergone a notable shift, moving from very attractive to attractive territory, reflecting a nuanced change in price attractiveness amid ongoing sector headwinds. Despite a challenging performance track record relative to the Sensex, the bank’s current price-to-earnings (P/E) and price-to-book value (P/BV) ratios suggest a recalibration of investor sentiment and potential opportunities for value-oriented investors.
Read full news article
Punjab & Sind Bank Upgraded to Hold on Improved Valuation and Financial Metrics
Punjab & Sind Bank has seen its investment rating upgraded from Sell to Hold, driven primarily by a marked improvement in valuation metrics and sustained financial performance. The bank’s valuation grade has shifted from attractive to very attractive, supported by robust profitability trends and solid capital adequacy, although certain challenges remain in market performance and investor sentiment.
Read full news article Announcements
Closure of Trading Window
30-Jun-2026 | Source : BSEClosure of Trading Window
Announcement under Regulation 30 (LODR)-Strikes /Lockouts / Disturbances
07-May-2026 | Source : BSENotice of Strike
Announcement under Regulation 30 (LODR)-Analyst / Investor Meet - Outcome
06-May-2026 | Source : BSETranscript of the Earnings Call with Analysts/Investors on Audited Financial Results for Quarter & Financial Year ended 31st March 2026
Corporate Actions

No Upcoming Board Meetings


No Splits history available

No Bonus history available

No Rights history available
Quality key factors
Valuation key factors
Technicals key factors
 Technical Indicator Scale: Bearish, Mildly Bearish, Sideways, Mildly Bullish, Bullish Turned
 Shareholding Snapshot : Mar 2026
Shareholding Compare (%holding)
Promoters
None
Held by 8 Schemes (0.11%)
Held by 8 FIIs (0.15%)
President Of India (93.85%)
Life Insurance Corporation Of India (1.33%)
1.83%
Quarterly Results Snapshot (Standalone) - Mar'26 - QoQ

QoQ Growth in quarter ended Mar 2026 is -0.39% vs 1.44% in Dec 2025

QoQ Growth in quarter ended Mar 2026 is 25.39% vs 14.23% in Dec 2025
Half Yearly Results Snapshot (Standalone) - Sep'25
Growth in half year ended Sep 2025 is 9.61% vs 14.18% in Sep 2024
Growth in half year ended Sep 2025 is 33.86% vs 23.21% in Sep 2024
Nine Monthly Results Snapshot (Standalone) - Dec'25
YoY Growth in nine months ended Dec 2025 is 7.56% vs 15.38% in Dec 2024
YoY Growth in nine months ended Dec 2025 is 28.03% vs 54.15% in Dec 2024
Annual Results Snapshot (Standalone) - Mar'26
YoY Growth in year ended Mar 2026 is 4.36% vs 18.44% in Mar 2025
YoY Growth in year ended Mar 2026 is 30.13% vs 70.61% in Mar 2025
About Punjab & Sind Bank

Company Coordinates


