UCO Bank

  • Market Cap: Mid Cap
  • Industry: Public Sector Bank
  • ISIN: INE691A01018
  • NSEID: UCOBANK
  • BSEID: 532505
INR
25.90
0.21 (0.82%)
BSENSE

Aug 20, 01:44 PM

BSE+NSE Vol: 11.58 lacs

  • Price Points
  • Score
  • Mojo Parameters
  • Total Return
  • News and Corporate Actions
  • Key factors
  • Shareholding
  • Financials
  • CompanyCV
stock-summaryPrice Point
High/Low

1Day

52 Week

Valuation
Technical
Day's Volume

CASH

11.58 lacs (-15.00%) Volume

Shareholding (Jun 2026)

FII

0.06%

Held by 16 FIIs

DII

4.31%

Held by 67 DIIs

Promoter

90.95%

Why is UCO Bank falling/rising?

20-Aug-2026

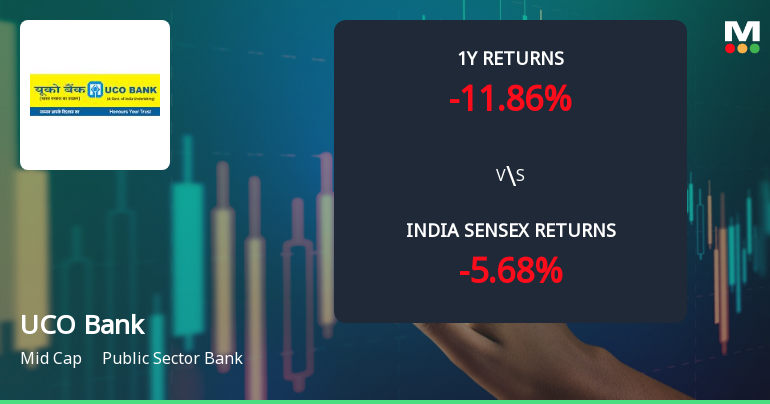
As of 19-Aug, UCO Bank's stock price is at 25.69, down 0.81%, and has underperformed its sector. The stock is in a bearish trend, trading below all key moving averages, with decreased investor participation and a year-to-date decline of 12.83%, despite strong lending practices.

As of 19-Aug, UCO Bank's stock price is falling, currently at 25.69, reflecting a change of -0.21 (-0.81%). The stock has underperformed its sector by -0.64% today and has experienced a consecutive decline over the last two days, with a total drop of -1.61% in that period. Additionally, UCO Bank is trading below its 5-day, 20-day, 50-day, 100-day, and 200-day moving averages, indicating a bearish trend.<BR><BR>Investor participation has also decreased, as evidenced by a delivery volume of 8.81 lacs on 18 August, which is down by -31.84% compared to the 5-day average. This decline in trading activity suggests a lack of confidence among investors. <BR><BR>Despite some positive factors, such as strong lending practices and a low Gross NPA ratio of 2.08%, the stock has struggled over the longer term, with a year-to-date decline of -12.83% compared to a -9.75% drop in the benchmark Sensex. The stock's performance over the past year shows a return of -11.99%, even as profits have increased by 12.6%, indicating a disconnect between stock price and company fundamentals. Overall, these factors contribute to the current downward movement of UCO Bank's stock price.

View full answer

Which are the latest news on UCO Bank?

20-Aug-2026

Who are in the management team of UCO Bank?

14-Aug-2026

The management team of UCO Bank includes Soma Sankara Prasad (Managing Director & CEO), Rajendra Kumar Saboo (Executive Director), and several directors, including nominees from the RBI and government, overseeing the bank's operations and strategy.

The management team of UCO Bank includes the following individuals:<BR><BR>1. **Soma Sankara Prasad** - Managing Director & CEO<BR>2. **Rajendra Kumar Saboo** - Executive Director<BR>3. **K Rajivan Nair** - Director (Shareholder)<BR>4. **Anjan Talukdar** - Non Official Director<BR>5. **Ravi Kumar Agrawal** - Non Official Director<BR>6. **Rajesh Kumar** - Nominee (RBI)<BR>7. **Sanjay Kumar** - Nominee (Govt)<BR>8. **Subhash Shankar Malik** - Non-official Director<BR>9. **Vikash Gupta** - Company Secretary & Compliance Officer<BR><BR>This team plays a crucial role in overseeing the operations and strategic direction of the bank.

View full answer

What does UCO Bank do?

14-Aug-2026

UCO Bank is a Government of India Undertaking commercial bank with a market capitalization of INR 32,879 Cr, reporting net sales of 6,996 Cr and a net profit of 656 Cr for June 2026. It offers a dividend yield of 1.53%.

Overview: <BR>UCO Bank is a commercial bank and a Government of India Undertaking, operating in the public sector banking industry with a mid-cap market capitalization.<BR><BR>History: <BR>UCO Bank was incorporated as a commercial bank and has maintained its status as a Government of India Undertaking. The latest quarterly results reported are for June 2026, showing sales and profit figures.<BR><BR>Financial Snapshot: <BR>Most recent Net Sales: 6,996.00 Cr (Quarterly Results - Jun 2026) <BR>Most recent Net Profit: 656 Cr (Quarterly Results - Jun 2026) <BR>Market-cap value: INR 32,879 Cr (Mid Cap)<BR><BR>Key Metrics: <BR>P/E: N/A <BR>Industry P/E: N/A <BR>Dividend Yield: 1.53% <BR>Debt-Equity: N/A <BR>ROE: N/A <BR>Price-to-Book: N/A <BR><BR>Contact Details: <BR>Address: 10 B T M Sarani, 7th Floor Kolkata West Bengal : 700001 <BR>Phone: 91-33-22254120/29 <BR>Email: hosgr.calcutta@ucobank.co.in <BR>Website: http://www.ucobank.com

View full answer

Who are the peers of the UCO Bank?

14-Aug-2026

UCO Bank's peers include Union Bank, Punjab National Bank, Bank of Baroda, Indian Bank, Canara Bank, Bank of India, Indian Overseas Bank, Bank of Maharashtra, Central Bank, and Punjab & Sind Bank. In terms of performance, Bank of Maharashtra leads with a 1-year return of 48.06%, while UCO Bank has a return of -7.09%.

Peers: The peers of UCO Bank are Union Bank (I), Punjab Natl.Bank, Bank Of Baroda, Indian Bank, Canara Bank, Bank Of India, I O B, Bank of Maha, Central Bank, and Pun. & Sind Bank.<BR><BR>Quality Snapshot: Excellent management risk is observed at Bank of Maha, while Good management risk is found at Union Bank (I), Punjab Natl.Bank, Bank Of Baroda, Indian Bank, Canara Bank, Bank Of India, I O B, UCO Bank, Central Bank, and Pun. & Sind Bank. Excellent growth is noted at Bank of Maha, while Good growth is seen at Union Bank (I), Punjab Natl.Bank, Bank Of Baroda, Indian Bank, Canara Bank, Bank Of India, I O B, UCO Bank, Central Bank, and Pun. & Sind Bank. Excellent capital structure is present at Union Bank (I), while Good capital structure is found at Punjab Natl.Bank, Bank Of Baroda, Indian Bank, Canara Bank, Bank Of India, I O B, UCO Bank, Bank of Maha, Central Bank, and Pun. & Sind Bank.<BR><BR>Return Snapshot: Bank of Maha has the highest 1-year return at 48.06%, while I O B has the lowest at -6.70%. UCO Bank's 1-year return of -7.09% is lower than both. Additionally, the six-month return is negative for Bank Of Baroda, Canara Bank, Bank Of India, I O B, Central Bank, and Pun. & Sind Bank.

View full answer

How big is UCO Bank?

14-Aug-2026

As of 14th August, UCO Bank has a market capitalization of 32,627.93 Cr and reported a net profit of 2,816.74 Cr, with shareholder's funds at 33,249.23 Cr and total assets valued at 3,95,858.45 Cr. There is no valid net sales data available for the latest four quarters.

As of 14th August, UCO Bank has a market capitalization of 32,627.93 Cr and is classified as a Mid Cap company.<BR><BR>In the latest four quarters, UCO Bank reported net sales of 0.00 Cr, indicating no valid net sales data found for summing. The net profit for the same period was 2,816.74 Cr.<BR><BR>The latest reporting period for the balance sheet is March 2026. Shareholder's funds stood at 33,249.23 Cr, while total assets were valued at 3,95,858.45 Cr.

View full answer

Should I buy, sell or hold UCO Bank?

23-Jul-2026

When is the next results date for UCO Bank?

17-Jul-2026

UCO Bank will announce its results on 22 July 2026.

UCO Bank will declare its results on 22 July 2026.

View full answer

Is UCO Bank technically bullish or bearish?

05-Dec-2025

As of December 4, 2025, UCO Bank's technical trend is bearish with moderate strength, supported by bearish moving averages and Bollinger Bands, despite some mixed signals from MACD and Dow Theory.

As of 4 December 2025, the technical trend for UCO Bank has changed from mildly bearish to bearish. The current stance is bearish with moderate strength. The weekly MACD is mildly bullish, but the monthly MACD and moving averages are both bearish, indicating a lack of strong upward momentum. The Bollinger Bands are bearish on both weekly and monthly time frames, reinforcing the bearish outlook. The KST shows a mixed signal with weekly bullishness but monthly bearishness. Dow Theory indicates a mildly bearish trend on the weekly and mildly bullish on the monthly, suggesting some conflicting signals. Overall, the combination of these indicators points to a bearish sentiment for UCO Bank at this time.

View full answer

Is UCO Bank overvalued or undervalued?

21-Nov-2025

As of November 20, 2025, UCO Bank is considered an attractive investment due to its undervalued status with a PE ratio of 15.46, a price-to-book value of 1.20, and a competitive ROE of 7.76%, despite a year-to-date stock performance of -29.19% compared to the Sensex's 9.59%.

As of 20 November 2025, UCO Bank's valuation grade has moved from fair to attractive, indicating a positive shift in its perceived value. The bank is currently considered undervalued, with a price-to-earnings (PE) ratio of 15.46, a price-to-book value of 1.20, and a PEG ratio of 1.54. These ratios suggest that the bank is trading at a reasonable valuation compared to its earnings growth potential.<BR><BR>In comparison to its peers, UCO Bank stands out with a PE ratio higher than that of State Bank of India (12.7) but lower than Bank of Baroda (7.75) and Punjab National Bank (9.09), both of which are also classified as attractive. Notably, UCO Bank's return on equity (ROE) is 7.76%, which is competitive within the sector. Despite recent stock performance trailing the Sensex, particularly with a year-to-date return of -29.19% compared to the Sensex's 9.59%, the overall valuation metrics suggest that UCO Bank presents a compelling investment opportunity at its current price of 31.05.

View full answer

Are UCO Bank latest results good or bad?

18-Oct-2025

UCO Bank's latest results are mixed; while it reported a net profit increase of 2.03% quarter-on-quarter, concerns about asset quality arose with a slight rise in the gross NPA ratio to 2.56%. Overall, improvements in profitability are overshadowed by challenges in asset quality and a minor decline in overall income.

UCO Bank's latest results present a mixed picture. On the positive side, the bank reported a net profit of ₹619.76 crore for Q2 FY26, which reflects a growth of 2.03% quarter-on-quarter and 2.82% year-on-year. Additionally, interest earned increased by 1.57% from the previous quarter, indicating a healthy demand for loans and improved asset deployment.<BR><BR>However, there are concerns regarding asset quality, as the gross non-performing assets (NPA) ratio slightly deteriorated to 2.56% from 2.63% in the previous quarter. This indicates a need for close monitoring of asset quality metrics. Furthermore, while the bank's operating profit showed a positive trend, the overall income experienced a minor decline of 0.16% quarter-on-quarter, which may raise questions about sustainability in growth.<BR><BR>Overall, while UCO Bank has shown improvements in profitability and operational efficiency, the challenges related to asset quality and margin pressures suggest that the results are not entirely positive. Investors should consider these factors when evaluating the bank's performance.

View full answer

How has been the historical performance of UCO Bank?

17-Oct-2025

UCO Bank has shown significant financial improvement from March 2021 to March 2025, with interest earned increasing from INR 14,446.16 crore to INR 25,066.90 crore, and profit before tax rising to INR 3,833.55 crore. The bank's total assets and deposits also grew substantially, reflecting a strong recovery and growth trajectory.

Answer:<BR>The historical performance of UCO Bank shows a significant improvement over the years, particularly from March 2021 to March 2025.<BR><BR>Breakdown:<BR>UCO Bank's interest earned has steadily increased from INR 14,446.16 crore in March 2021 to INR 25,066.90 crore in March 2025, reflecting a strong growth trajectory. The net interest income also rose significantly, from INR 5,479.71 crore in March 2021 to INR 9,630.07 crore in March 2025. Total income followed a similar trend, growing from INR 17,870.34 crore in March 2021 to INR 29,473.53 crore in March 2025. Profit before tax turned positive in March 2022 after several years of losses, reaching INR 3,833.55 crore by March 2025, while profit after tax also improved from INR 167.04 crore in March 2021 to INR 2,444.96 crore in March 2025. The bank's total assets increased from INR 2,53,336.10 crore in March 2021 to INR 3,62,481.09 crore in March 2025, with deposits rising from INR 2,05,919.39 crore to INR 2,93,542.18 crore during the same period. The capital adequacy ratio improved significantly, indicating a stronger financial position, moving from 13.74% in March 2021 to 18.49% in March 2025. Overall, UCO Bank has demonstrated a robust recovery and growth in its financial performance over the years.

View full answer

Who are the top shareholders of the UCO Bank?

06-Jun-2025

The top shareholders of UCO Bank include the President of India with a 90.95% stake, the Life Insurance Corporation of India at 2.31%, and individual investors holding 2.95%. Additionally, mutual funds and foreign institutional investors collectively own 0.53%.

The top shareholders of UCO Bank are primarily dominated by the President of India, who holds a significant 90.95% stake in the bank. Other notable shareholders include the Life Insurance Corporation of India, which holds 2.31%, and individual investors, who collectively own 2.95%. Additionally, the bank has mutual funds represented by 14 schemes holding 0.09% and 24 foreign institutional investors (FIIs) with a combined holding of 0.44%.

View full answer

Has UCO Bank declared dividend?

06-Jun-2025

Yes, UCO Bank has declared a 3% dividend, with an ex-date of May 9, 2025. Despite recent negative price returns, the bank has shown strong total returns over longer periods.

UCO Bank has declared a 3% dividend.<BR><BR>Dividend Details:<BR>- Percentage announced: 3%<BR>- Ex-date: 09 May 25<BR><BR>Dividend Yield: 0.89%<BR><BR>Total Returns by Period:<BR>In the last 6 months, UCO Bank experienced a price return of -33.89%, a dividend return of 0.61%, resulting in a total return of -33.28%.<BR><BR>Over the past year, the price return was -41.17%, with a dividend return of 0.53%, leading to a total return of -40.64%.<BR><BR>In a 2-year period, the price return was 21.66%, the dividend return was 1.87%, culminating in a total return of 23.53%.<BR><BR>For the 3-year period, UCO Bank saw a price return of 186.16%, a dividend return of 4.47%, resulting in a total return of 190.63%.<BR><BR>In the last 4 years, the price return was 144.67%, the dividend return was 3.28%, leading to a total return of 147.95%.<BR><BR>Over the 5-year period, the price return was 158.64%, with a dividend return of 3.40%, resulting in a total return of 162.04%.<BR><BR>Overall, UCO Bank has declared a dividend while experiencing significant fluctuations in total returns across different periods, with particularly strong performance in the longer term despite recent negative price returns.

View full answer
iScoreScore
Click here to find our call on this stock
Strong Sell
Sell
Hold
Buy
Strong Buy

Dashboard

1

Strong lending practices with low Gross NPA ratio of 2.08%

 
2

Strong Long Term Fundamental Strength with a 62.66% CAGR growth in Net Profits

 
3

Healthy long term growth as Net profit has grown by an annual rate of 62.66%

 
4

The company has declared Positive results for the last 9 consecutive quarters

5

With ROA of 0.7, it has a Very Attractive valuation with a 0.9 Price to Book Value

6

Majority shareholders : Promoters

 
7

Underperformed the market in the last 1 year

stock-summaryMojo Parameters

Mojo Parameters

Loading Valuation Snapshot...

Stock DNA

stock-summary
Industry

Public Sector Bank

stock-summary
Market cap

INR 32,477 Cr (Mid Cap)

stock-summary
Dividend Yield

1.56%

stock-summary
CAR

17.44%

stock-summary
Return on Assets

0.70%

stock-summary
Net NPA

0.25%

stock-summary
Gross NPA

2.08%

Revenue and Profits:
Int. Earned:
6,996.00 Cr
(Quarterly Results - Jun 2026)
Net Profit:
656 Cr
stock-summaryTotal Returns
Total Returns (Price + Dividend) stock-summary
Dividend Yield (1.56%)
TimePeriod
Price Return
Dividend Return
Total Return
3 Months
5.46%
0%
5.46%
6 Months
-10.63%
1.39%
-9.24%
1 Year
-11.48%
1.39%
-10.09%
2 Years
-50.38%
1.37%
-49.01%
3 Years
-16.91%
2.62%
-14.29%
4 Years
124.24%
7.23%
131.47%
5 Years
101.4%
6.62%
108.02%

Latest dividend: 0.4 per share ex-dividend date: May-04-2026

Risk Adjusted Returns v/s stock-summary
Returns Beta
Icon
Beta has not been calculated since enough price history is not available
stock-summaryNews & Corporate Actions

Announcements stock-summary

Announcement under Regulation 30 (LODR)-Credit Rating

14-Aug-2026 | Source : BSE

Reaffirmation of CD Ratings

Announcement under Regulation 30 (LODR)-Change in Directorate

13-Aug-2026 | Source : BSE

Appointment of Shri Manohar Lal Paliwal as Part-time Non-Official Director on the Board of the Bank

Announcement under Regulation 30 (LODR)-Interest Rates Updates

07-Aug-2026 | Source : BSE

Update on Benchmark Rates of the Bank

Corporate Actions stock-summary

stock-summary
BOARD MEETING

No Upcoming Board Meetings

stock-summary
DIVIDEND

UCO Bank has declared 4% dividend, ex-date: 04 May 26

stock-summary
SPLITS

No Splits history available

stock-summary
BONUS

No Bonus history available

stock-summary
RIGHTS

No Rights history available

stock-summaryKey Factors

Quality key factors stock-summary

Factor
Value
Net Interest Income Growth (5y)
8.99%
Net Profit Growth (5y)
62.66%
Advance to Deposit
68.68%
Capital Adequacy Ratio (Tier 1)
14.80%
Gross NPA (latest)
2.08%
Gross NPA (avg)
3.99%
Coverage Ratio (avg)
78.17%
Cost to Income (avg)
54.34%
Net Interest Margin (avg)
2.94%
Operating Profit to Assets (avg)
3.85%
ROA (avg)
0.60%
Net Debt to Equity (avg)
0

Valuation key factors

Factor
Value
P/E Ratio
13
Price to Book Value
0.95
PEG Ratio
0.91
Dividend Yield
1.56%
ROE (Latest)
8.28%
ROA (Latest)
0.70%
Net NPA to Book Value
1.99

Technicals key factors

Indicator
Weekly
Monthly
MACD
Mildly Bullish
Bearish
RSI
No Signal
No Signal
Bollinger Bands
Sideways
Bearish
Moving Averages
Bearish (Daily)
KST
Bullish
Bearish
Dow Theory
Mildly Bearish
No Trend
OBV
No Trend
Mildly Bearish
stock-summary Technical Indicator Scale: Bearish, Mildly Bearish, Sideways, Mildly Bullish, Bullish  Turned 
stock-summaryShareholding
Shareholding Snapshot : Jun 2026stock-summary
Shareholding Compare (%holding) stock-summary
Majority shareholders

Promoters

Pledged Promoter Holdings

None

Mutual Funds

Held by 16 Schemes (0.3%)

FIIs

Held by 16 FIIs (0.06%)

Promoter with highest holding

President Of India (90.95%)

Highest Public shareholder

Life Insurance Corporation Of India Limited (2.31%)

Individual Investors Holdings

4.22%

stock-summaryFinancial
[
  {
    "link": "quarterly",
    "btn_text": "All Quarterly Results",
    "header": "Quarterly Results Snapshot (Standalone) - Jun'26 - QoQ",
    "rhs": [
      {
        "prefix": "Interest Earned ",
        "suffix": "QoQ Growth in quarter ended Jun 2026 is 5.1% vs 0.07% in Mar 2026",
        "dir": 1
      },
      {
        "prefix": "Net Profit ",
        "suffix": "QoQ Growth in quarter ended Jun 2026 is -18.08% vs 8.34% in Mar 2026",
        "dir": -1
      }
    ],
    "table": {
      "header": [
        "Jun'26",
        "Mar'26",
        "Change(%)"
      ],
      "body": [
        {
          "field": "Interest Earned",
          "val1": 6996,
          "val2": 6656.33,
          "chgp": "5.1%",
          "chgp_class": "positive"
        },
        {
          "field": "Operating Profit (PBDIT)",
          "val1": "2,809.54",
          "val2": "1,573.24",
          "chgp": "78.58%",
          "chgp_class": "positive"
        },
        {
          "field": "% of Net NPAs",
          "val1": "0.25%",
          "val2": "0.27%",
          "chgp": "-0.02%",
          "chgp_class": "positive"
        },
        {
          "field": "% of Gross NPAs",
          "val1": "2.08%",
          "val2": "2.17%",
          "chgp": "-0.09%",
          "chgp_class": "positive"
        },
        {
          "field": "Exceptional Items",
          "val1": "0.00",
          "val2": "0.00",
          "chgp": "",
          "chgp_class": "neutral"
        },
        {
          "field": "Net Profit",
          "val1": "656.32",
          "val2": "801.15",
          "chgp": "-18.08%",
          "chgp_class": "negative"
        }
      ]
    }
  },
  {
    "link": "half-yearly",
    "btn_text": "All Half Yearly Results",
    "header": "Half Yearly Results Snapshot (Standalone) - Sep'25",
    "rhs": [
      {
        "prefix": "Interest Earned ",
        "suffix": " Growth in half year ended Sep 2025 is 7.2% vs 15.89% in Sep 2024",
        "dir": -1
      },
      {
        "prefix": "Net Profit ",
        "suffix": " Growth in half year ended Sep 2025 is 6.37% vs 84.55% in Sep 2024",
        "dir": -1
      }
    ],
    "table": {
      "header": [
        "Sep'25",
        "Sep'24",
        "Change(%)"
      ],
      "body": [
        {
          "field": "Interest Earned",
          "val1": 12973.18,
          "val2": 12102.35,
          "chgp": "7.2%",
          "chgp_class": "positive"
        },
        {
          "field": "Operating Profit (PBDIT)",
          "val1": "3,175.46",
          "val2": "2,752.83",
          "chgp": "15.35%",
          "chgp_class": "positive"
        },
        {
          "field": "% of Net NPAs",
          "val1": "0.43%",
          "val2": "0.73%",
          "chgp": "-0.30%",
          "chgp_class": "positive"
        },
        {
          "field": "% of Gross NPAs",
          "val1": "2.56%",
          "val2": "3.18%",
          "chgp": "-0.62%",
          "chgp_class": "positive"
        },
        {
          "field": "Exceptional Items",
          "val1": "0.00",
          "val2": "0.00",
          "chgp": "",
          "chgp_class": "neutral"
        },
        {
          "field": "Net Profit",
          "val1": "1,227.20",
          "val2": "1,153.70",
          "chgp": "6.37%",
          "chgp_class": "positive"
        }
      ]
    }
  },
  {
    "link": "nine-monthly",
    "btn_text": "All Nine Monthly Results",
    "header": "Nine Monthly Results Snapshot (Standalone) - Dec'25",
    "rhs": [
      {
        "prefix": "Interest Earned ",
        "suffix": "YoY Growth in nine months ended Dec 2025 is 7.11% vs 14.55% in Dec 2024",
        "dir": -1
      },
      {
        "prefix": "Net Profit ",
        "suffix": "YoY Growth in nine months ended Dec 2025 is 9.72% vs 58.92% in Dec 2024",
        "dir": -1
      }
    ],
    "table": {
      "header": [
        "Dec'25",
        "Dec'24",
        "Change(%)"
      ],
      "body": [
        {
          "field": "Interest Earned",
          "val1": 19625.02,
          "val2": 18322.31,
          "chgp": "7.11%",
          "chgp_class": "positive"
        },
        {
          "field": "Operating Profit (PBDIT)",
          "val1": "4,855.70",
          "val2": "4,338.52",
          "chgp": "11.92%",
          "chgp_class": "positive"
        },
        {
          "field": "% of Net NPAs",
          "val1": "0.36%",
          "val2": "0.63%",
          "chgp": "-0.27%",
          "chgp_class": "positive"
        },
        {
          "field": "% of Gross NPAs",
          "val1": "2.41%",
          "val2": "2.91%",
          "chgp": "-0.50%",
          "chgp_class": "positive"
        },
        {
          "field": "Exceptional Items",
          "val1": "0.00",
          "val2": "0.00",
          "chgp": "",
          "chgp_class": "neutral"
        },
        {
          "field": "Net Profit",
          "val1": "1,966.71",
          "val2": "1,792.53",
          "chgp": "9.72%",
          "chgp_class": "positive"
        }
      ]
    }
  },
  {
    "link": "annual",
    "btn_text": "All Annual Results",
    "header": "Annual Results Snapshot (Standalone) - Mar'26",
    "rhs": [
      {
        "prefix": "Interest Earned ",
        "suffix": "YoY Growth in year ended Mar 2026 is 4.84% vs 14.7% in Mar 2025",
        "dir": -1
      },
      {
        "prefix": "Net Profit ",
        "suffix": "YoY Growth in year ended Mar 2026 is 13.21% vs 47.84% in Mar 2025",
        "dir": -1
      }
    ],
    "table": {
      "header": [
        "Mar'26",
        "Mar'25",
        "Change(%)"
      ],
      "body": [
        {
          "field": "Interest Earned",
          "val1": 26281.35,
          "val2": 25066.9,
          "chgp": "4.84%",
          "chgp_class": "positive"
        },
        {
          "field": "Operating Profit (PBDIT)",
          "val1": "6,428.94",
          "val2": "6,037.29",
          "chgp": "6.49%",
          "chgp_class": "positive"
        },
        {
          "field": "% of Net NPAs",
          "val1": "0.27%",
          "val2": "0.50%",
          "chgp": "-0.23%",
          "chgp_class": "positive"
        },
        {
          "field": "% of Gross NPAs",
          "val1": "2.17%",
          "val2": "2.69%",
          "chgp": "-0.52%",
          "chgp_class": "positive"
        },
        {
          "field": "Exceptional Items",
          "val1": "0.00",
          "val2": "0.00",
          "chgp": "",
          "chgp_class": "neutral"
        },
        {
          "field": "Net Profit",
          "val1": "2,767.86",
          "val2": "2,444.96",
          "chgp": "13.21%",
          "chgp_class": "positive"
        }
      ]
    }
  }
]

Quarterly Results Snapshot (Standalone) - Jun'26 - QoQstock-summary

Jun'26
Mar'26
Change(%)
Interest Earned
6996
6656.33
5.1%
Operating Profit (PBDIT)
2,809.54
1,573.24
78.58%
% of Net NPAs
0.25%
0.27%
-0.02%
% of Gross NPAs
2.08%
2.17%
-0.09%
Exceptional Items
0.00
0.00
Net Profit
656.32
801.15
-18.08%
Values in Rs Cr.
Direction Arrows
Interest Earned

QoQ Growth in quarter ended Jun 2026 is 5.1% vs 0.07% in Mar 2026

Direction Arrows
Net Profit

QoQ Growth in quarter ended Jun 2026 is -18.08% vs 8.34% in Mar 2026

Half Yearly Results Snapshot (Standalone) - Sep'25stock-summary

Sep'25
Sep'24
Change(%)
Interest Earned
12973.18
12102.35
7.2%
Operating Profit (PBDIT)
3,175.46
2,752.83
15.35%
% of Net NPAs
0.43%
0.73%
-0.30%
% of Gross NPAs
2.56%
3.18%
-0.62%
Exceptional Items
0.00
0.00
Net Profit
1,227.20
1,153.70
6.37%
Values in Rs Cr.
Direction Arrows
Interest Earned

Growth in half year ended Sep 2025 is 7.2% vs 15.89% in Sep 2024

Direction Arrows
Net Profit

Growth in half year ended Sep 2025 is 6.37% vs 84.55% in Sep 2024

Nine Monthly Results Snapshot (Standalone) - Dec'25stock-summary

Dec'25
Dec'24
Change(%)
Interest Earned
19625.02
18322.31
7.11%
Operating Profit (PBDIT)
4,855.70
4,338.52
11.92%
% of Net NPAs
0.36%
0.63%
-0.27%
% of Gross NPAs
2.41%
2.91%
-0.50%
Exceptional Items
0.00
0.00
Net Profit
1,966.71
1,792.53
9.72%
Values in Rs Cr.
Direction Arrows
Interest Earned

YoY Growth in nine months ended Dec 2025 is 7.11% vs 14.55% in Dec 2024

Direction Arrows
Net Profit

YoY Growth in nine months ended Dec 2025 is 9.72% vs 58.92% in Dec 2024

Annual Results Snapshot (Standalone) - Mar'26stock-summary

Mar'26
Mar'25
Change(%)
Interest Earned
26281.35
25066.9
4.84%
Operating Profit (PBDIT)
6,428.94
6,037.29
6.49%
% of Net NPAs
0.27%
0.50%
-0.23%
% of Gross NPAs
2.17%
2.69%
-0.52%
Exceptional Items
0.00
0.00
Net Profit
2,767.86
2,444.96
13.21%
Values in Rs Cr.
Direction Arrows
Interest Earned

YoY Growth in year ended Mar 2026 is 4.84% vs 14.7% in Mar 2025

Direction Arrows
Net Profit

YoY Growth in year ended Mar 2026 is 13.21% vs 47.84% in Mar 2025

stock-summaryCompany CV
About UCO Bank stock-summary
stock-summary
UCO Bank
Mid Cap
Public Sector Bank
UCO Bank is a commercial bank and a Government of India Undertaking. The Bank offers a host of value added banking solutions to their customers, which includes international banking services, services for NRIs, loan schemes, deposit schemes and value added e-banking solutions. They also possess a host of branches authorized for direct tax collection in India. UCO Bank head office is located in Kolkata. The Bank has 34 Regional Offices spread all over India.
Company Coordinates stock-summary
Company Details
10 B T M Sarani, 7th Floor Kolkata West Bengal : 700001
stock-summary
Tel: 91-33-22254120/29
stock-summary
hosgr.calcutta@ucobank.co.in
Registrar Details
Karvy Computershare Pvt Ltd, Plot No 17-24 , Near Image Hospital,, Reliance Cybervilae,Vithalrao Nagar,, Madhapur, Hyderabad