
Compare FDC with Similar Stocks
Stock DNA
Pharmaceuticals & Biotechnology
INR 6,999 Cr (Small Cap)
24.00
35
1.16%
-0.20
11.98%
2.82
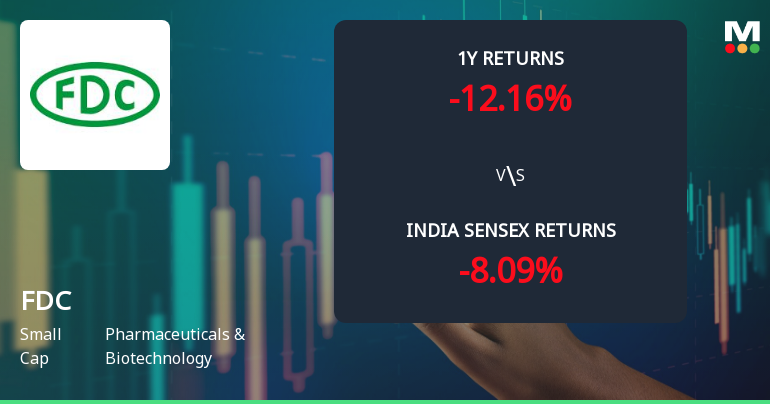
Total Returns (Price + Dividend) 
Latest dividend: 5.0160751028806585 per share ex-dividend date: Feb-11-2026
Risk Adjusted Returns v/s
Returns Beta

News
FDC Ltd Technical Momentum Shifts Amid Mixed Indicator Signals
FDC Ltd, a small-cap player in the Pharmaceuticals & Biotechnology sector, has exhibited a notable shift in its technical momentum, moving from a mildly bearish stance to a sideways trend. This transition is underscored by a complex interplay of technical indicators, including MACD, RSI, Bollinger Bands, and moving averages, which collectively paint a nuanced picture of the stock’s near-term prospects.
Read full news article
FDC Ltd is Rated Sell
FDC Ltd is rated 'Sell' by MarketsMOJO, with this rating last updated on 27 May 2026. While the rating change occurred on that date, the analysis and financial metrics discussed here reflect the stock’s current position as of 25 June 2026, providing investors with the most up-to-date perspective on the company’s fundamentals, valuation, financial trends, and technical outlook.
Read full news article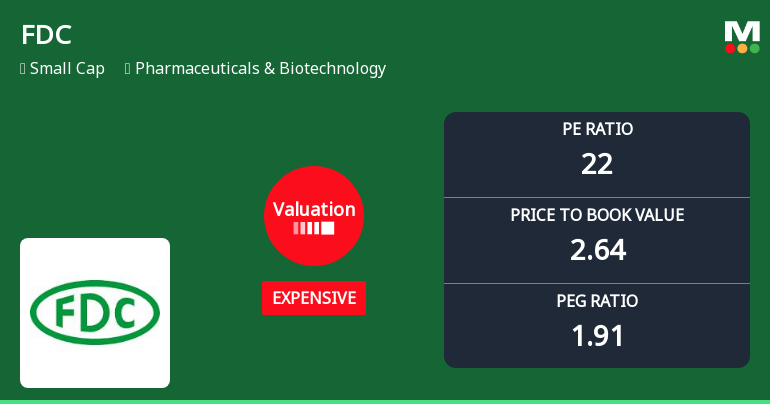
FDC Ltd Valuation Shifts Signal Price Attractiveness Challenges Amid Sector Comparisons
FDC Ltd, a small-cap player in the Pharmaceuticals & Biotechnology sector, has seen its valuation parameters shift notably, with its price-to-earnings (P/E) and price-to-book value (P/BV) ratios moving from fair to expensive territory. This change, coupled with a recent upgrade in its Mojo Grade from Strong Sell to Sell, invites a closer examination of its price attractiveness relative to historical levels and peer benchmarks.
Read full news article Announcements
Disclosures under Reg. 29(2) of SEBI (SAST) Regulations 2011
29-Jun-2026 | Source : BSEThe Exchange has received the disclosure under Regulation 29(2) of SEBI (Substantial Acquisition of Shares & Takeovers) Regulations 2011 for Mohan Anand Chandavarkar Trust (through its Managing Trustee Nandan Mohan Chandavarkar) & PACs
Disclosures under Reg. 29(2) of SEBI (SAST) Regulations 2011
29-Jun-2026 | Source : BSEThe Exchange has received the disclosure under Regulation 29(2) of SEBI (Substantial Acquisition of Shares & Takeovers) Regulations 2011 for Sandhya Mohan Chandavarkar Trust (through its Managing Trustee Nandan Mohan Chandavarkar) & PACs
Disclosures under Reg. 29(2) of SEBI (SAST) Regulations 2011
29-Jun-2026 | Source : BSEThe Exchange has received the disclosure under Regulation 29(2) of SEBI (Substantial Acquisition of Shares & Takeovers) Regulations 2011 for Nandan Mohan Chandavarkar & PACs
Corporate Actions

No Upcoming Board Meetings

FDC Ltd has declared 500% dividend, ex-date: 11 Feb 26

No Splits history available

No Bonus history available

No Rights history available
Quality key factors
Valuation key factors
Technicals key factors
 Technical Indicator Scale: Bearish, Mildly Bearish, Sideways, Mildly Bullish, Bullish Turned
 Shareholding Snapshot : Mar 2026
Shareholding Compare (%holding)
Promoters
None
Held by 6 Schemes (6.23%)
Held by 94 FIIs (2.4%)
Nomita R Chandavarkar (22.67%)
Icici Prudential Smallcap Fund (2.76%)
16.82%
Quarterly Results Snapshot (Consolidated) - Mar'26 - QoQ

QoQ Growth in quarter ended Mar 2026 is 25.84% vs -1.76% in Dec 2025
QoQ Growth in quarter ended Mar 2026 is 265.37% vs -0.25% in Dec 2025
Half Yearly Results Snapshot (Consolidated) - Sep'25

Growth in half year ended Sep 2025 is -2.66% vs 12.65% in Sep 2024
Growth in half year ended Sep 2025 is -21.65% vs 6.33% in Sep 2024
Nine Monthly Results Snapshot (Consolidated) - Dec'25
YoY Growth in nine months ended Dec 2025 is -1.86% vs 9.14% in Dec 2024
YoY Growth in nine months ended Dec 2025 is -21.96% vs -11.90% in Dec 2024
Annual Results Snapshot (Consolidated) - Mar'26
YoY Growth in year ended Mar 2026 is 2.98% vs 8.50% in Mar 2025
YoY Growth in year ended Mar 2026 is 5.48% vs -12.59% in Mar 2025
About FDC Ltd

Company Coordinates


