
Compare Kiri Industries with Similar Stocks
Dashboard
With a Operating Losses, the company has a Weak Long Term Fundamental Strength
- Company's ability to service its debt is weak with a poor EBIT to Interest (avg) ratio of -0.82
- The company has been able to generate a Return on Equity (avg) of 8.02% signifying low profitability per unit of shareholders funds
Risky - Negative EBITDA
Despite the size of the company, domestic mutual funds hold only 0% of the company
Stock DNA
Dyes And Pigments
INR 2,645 Cr (Small Cap)
5.00
21
0.00%
-0.63
7.85%
0.41
Total Returns (Price + Dividend) 
Latest dividend: 0.5 per share ex-dividend date: Sep-17-2020
Risk Adjusted Returns v/s
Returns Beta

News
Kiri Industries Ltd is Rated Strong Sell
Kiri Industries Ltd is rated Strong Sell by MarketsMOJO, with this rating last updated on 02 June 2025. However, the analysis and financial metrics discussed here reflect the company’s current position as of 17 July 2026, providing investors with an up-to-date view of the stock’s fundamentals, valuation, financial trends, and technical outlook.
Read full news article
Kiri Industries Ltd is Rated Strong Sell
Kiri Industries Ltd is rated Strong Sell by MarketsMOJO, with this rating last updated on 02 June 2025. However, the analysis and financial metrics discussed here reflect the company’s current position as of 06 July 2026, providing investors with an up-to-date view of the stock’s fundamentals, valuation, financial trend, and technical outlook.
Read full news article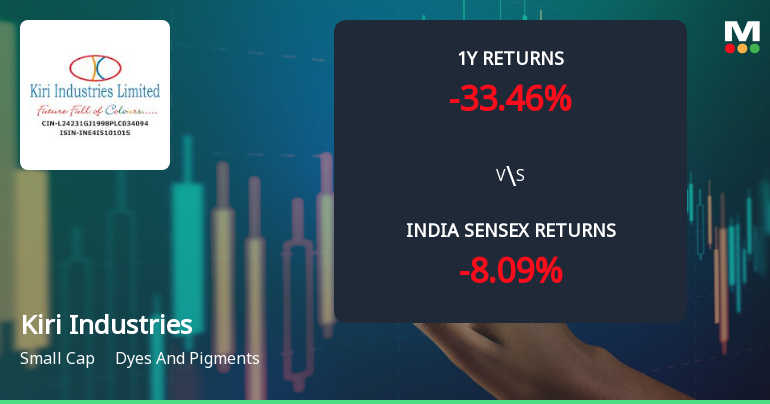
Kiri Industries Ltd Technical Momentum Shifts Amid Bearish Market Sentiment
Kiri Industries Ltd, a small-cap player in the Dyes and Pigments sector, has experienced a subtle shift in its technical momentum, moving from a bearish to a mildly bearish trend. Despite a modest day gain of 0.28%, the stock’s broader technical indicators reveal a complex picture of mixed signals, underscoring the challenges faced by investors amid persistent downward pressure and volatile market conditions.
Read full news article Announcements
Compliances-Certificate under Reg. 74 (5) of SEBI (DP) Regulations 2018
09-Jul-2026 | Source : BSECertificate under Reg 74(5) of SEBI (DP) Reg2018 for the quarter ended june 30 2026.
Closure of Trading Window
29-Jun-2026 | Source : BSEIntimation of Closure of Trading Window for the declaration of results for the quarter ended 30-06-2026.
Announcement under Regulation 30 (LODR)-Earnings Call Transcript
03-Jun-2026 | Source : BSEPlease find enclosed herewith Transcript of Q4-FY26/FY26 Earnings Conference Call held on Monday June 01 2026.
Corporate Actions

No Upcoming Board Meetings

Kiri Industries Ltd has declared 5% dividend, ex-date: 17 Sep 20

No Splits history available

No Bonus history available

No Rights history available
Quality key factors
Valuation key factors
Technicals key factors
 Technical Indicator Scale: Bearish, Mildly Bearish, Sideways, Mildly Bullish, Bullish Turned
 Shareholding Snapshot : Jun 2026
Shareholding Compare (%holding)
Promoters
0.2191
Held by 1 Schemes (0.0%)
Held by 44 FIIs (16.75%)
Anupama Manishkumar Kiri (14.58%)
Griffin Growth Fund Vcc (5.11%)
29.17%
Quarterly Results Snapshot (Consolidated) - Mar'26 - QoQ

QoQ Growth in quarter ended Mar 2026 is 44.31% vs -18.67% in Dec 2025

QoQ Growth in quarter ended Mar 2026 is -89.76% vs 25,457.30% in Dec 2025
Half Yearly Results Snapshot (Consolidated) - Sep'25
Growth in half year ended Sep 2025 is -22.67% vs 17.37% in Sep 2024
Growth in half year ended Sep 2025 is -81.21% vs 875.32% in Sep 2024
Nine Monthly Results Snapshot (Consolidated) - Dec'25
YoY Growth in nine months ended Dec 2025 is -17.72% vs 15.98% in Dec 2024
YoY Growth in nine months ended Dec 2025 is 1,406.29% vs 122.37% in Dec 2024
Annual Results Snapshot (Consolidated) - Mar'26
YoY Growth in year ended Mar 2026 is 13.46% vs 4.43% in Mar 2025
YoY Growth in year ended Mar 2026 is 2,002.80% vs 59.26% in Mar 2025
About Kiri Industries Ltd

Company Coordinates


