
Compare Kalind with Similar Stocks
Dashboard
Weak Long Term Fundamental Strength with an average Return on Equity (ROE) of 5.94%
With a growth in Net Profit of 509.76%, the company declared Very Positive results in Mar 26
With ROE of 15.1, it has a Expensive valuation with a 4.8 Price to Book Value
Reducing Promoter Confidence
Consistent Returns over the last 3 years
Stock DNA
Non Banking Financial Company (NBFC)
INR 1,018 Cr (Micro Cap)
32.00
21
0.03%
0.05
15.12%
4.85
Total Returns (Price + Dividend) 
Latest dividend: 0.03659671 per share ex-dividend date: Aug-14-2025
Risk Adjusted Returns v/s
Returns Beta

News

Kalind Ltd Upgraded to Hold as Valuation and Financial Trends Improve
Kalind Ltd, a micro-cap player in the Non Banking Financial Company (NBFC) sector, has seen its investment rating upgraded from Sell to Hold as of 29 June 2026. This change reflects a nuanced improvement across valuation metrics, financial trends, and technical indicators, despite some lingering concerns over promoter confidence and long-term fundamentals.
Read full news article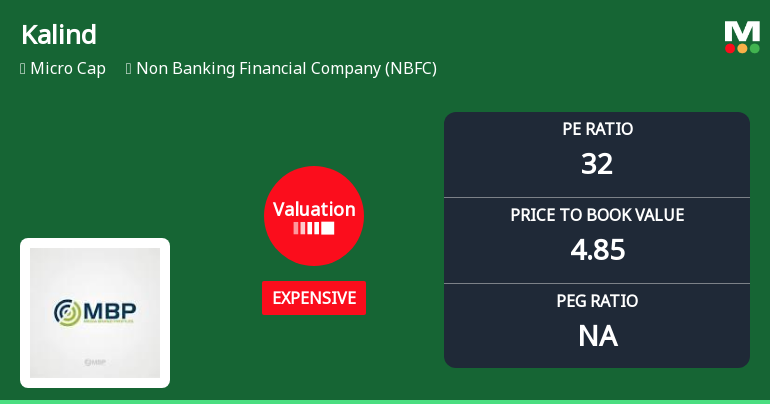
Kalind Ltd Valuation Shift Signals Price Attractiveness Amid NBFC Sector Dynamics
Kalind Ltd, a micro-cap player in the Non Banking Financial Company (NBFC) sector, has experienced a notable shift in its valuation parameters, moving from a very expensive to an expensive rating. This article analyses the recent changes in its price-to-earnings (P/E) and price-to-book value (P/BV) ratios, compares these with historical and peer averages, and assesses the implications for investors amid a volatile market backdrop.
Read full news article
Kalind Ltd is Rated Sell by MarketsMOJO
Kalind Ltd is rated 'Sell' by MarketsMOJO, with this rating last updated on 09 June 2026. However, the analysis and financial metrics presented here reflect the stock's current position as of 21 June 2026, providing investors with the latest insights into its performance and outlook.
Read full news article Announcements
Closure of Trading Window
23-Jun-2026 | Source : BSEClosure of Trading Window from Wednesday 1st July 2026 till 48 hours after declaration of Unaudited Financial Results of the Company for quarter ended 30th June 2026
Announcement under Regulation 30 (LODR)-Newspaper Publication
05-Jun-2026 | Source : BSEAdvertisement of Postal Ballot Notice dated 03.06.2026
Shareholder Meeting / Postal Ballot-Notice of Postal Ballot
04-Jun-2026 | Source : BSEPostal Ballot Notice dated 03.06.2026 is attached.
Corporate Actions

No Upcoming Board Meetings

Kalind Ltd has declared 10% dividend, ex-date: 14 Aug 25

No Splits history available

No Bonus history available

Kalind Ltd has announced 139:100 rights issue, ex-date: 30 Jan 26
Quality key factors
Valuation key factors
Technicals key factors
 Technical Indicator Scale: Bearish, Mildly Bearish, Sideways, Mildly Bullish, Bullish Turned
 Shareholding Snapshot : Dec 2025
Shareholding Compare (%holding)
Non Institution
None
Held by 0 Schemes
Held by 0 FIIs
Dharmendrabhai Becharbhai Jasani (17.79%)
None
74.34%
Quarterly Results Snapshot (Consolidated) - Mar'26 - QoQ

QoQ Growth in quarter ended Mar 2026 is 119.42% vs -16.03% in Dec 2025
QoQ Growth in quarter ended Mar 2026 is 509.76% vs -73.35% in Dec 2025
Half Yearly Results Snapshot (Consolidated) - Sep'25
Growth in half year ended Sep 2025 is 0.00% vs -100.00% in Sep 2024
Growth in half year ended Sep 2025 is 8,664.71% vs -342.86% in Sep 2024
Nine Monthly Results Snapshot (Consolidated) - Dec'25
YoY Growth in nine months ended Dec 2025 is 0.00% vs -100.00% in Dec 2024
YoY Growth in nine months ended Dec 2025 is 4,700.00% vs -248.00% in Dec 2024
Annual Results Snapshot (Consolidated) - Mar'26
YoY Growth in year ended Mar 2026 is 0.00% vs -100.00% in Mar 2025
YoY Growth in year ended Mar 2026 is 18,253.33% vs -138.46% in Mar 2025
About Kalind Ltd

Company Coordinates


