
Compare Jindal Worldwide with Similar Stocks
Dashboard
Poor long term growth as Net Sales has grown by an annual rate of 6.10% and Operating profit at 6.10% over the last 5 years
The company has declared positive results in Mar'2026 after 3 consecutive negative quarters
With ROCE of 11, it has a Very Attractive valuation with a 3.1 Enterprise value to Capital Employed
Despite the size of the company, domestic mutual funds hold only 0% of the company
Consistent Underperformance against the benchmark over the last 3 years
Stock DNA
Garments & Apparels
INR 3,070 Cr (Small Cap)
44.00
26
0.00%
0.23
8.11%
3.61
Total Returns (Price + Dividend) 
Latest dividend: 0.04 per share ex-dividend date: Sep-09-2024
Risk Adjusted Returns v/s
Returns Beta

News

Jindal Worldwide Ltd Upgraded to Hold on Improved Valuation and Financial Metrics
Jindal Worldwide Ltd, a small-cap player in the Garments & Apparels sector, has seen its investment rating upgraded from Sell to Hold as of 24 June 2026. This change reflects significant improvements in valuation metrics and financial performance, despite ongoing challenges in long-term growth and market returns. The company’s mojo score has risen to 51.0, signalling a cautious but positive outlook amid a volatile textile industry landscape.
Read full news article
Jindal Worldwide Ltd Downgraded to Sell Amid Valuation and Growth Concerns
Jindal Worldwide Ltd, a small-cap player in the Garments & Apparels sector, has seen its investment rating downgraded from Hold to Sell as of 19 June 2026. This shift reflects a complex interplay of valuation adjustments, financial trends, quality assessments, and technical factors, despite some recent positive quarterly results. The company’s Mojo Score now stands at 48.0, signalling caution for investors amid ongoing challenges and underperformance relative to benchmarks.
Read full news article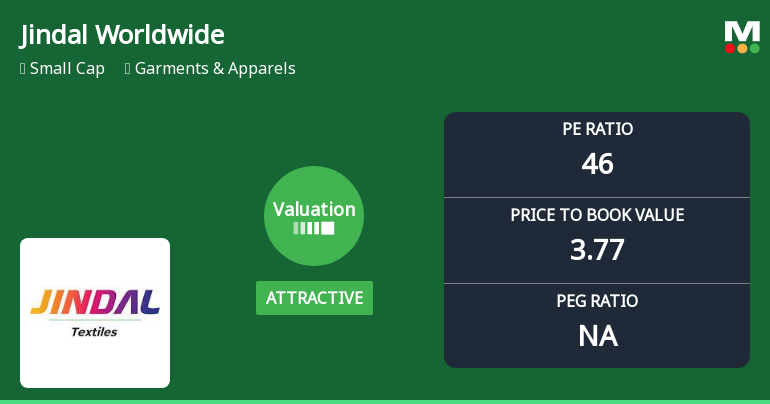
Jindal Worldwide Ltd Valuation Shifts Signal Changing Market Sentiment
Jindal Worldwide Ltd, a small-cap player in the Garments & Apparels sector, has seen its valuation parameters shift from very attractive to attractive, reflecting a nuanced change in market perception. Despite a strong recent price rally, the company’s price-to-earnings (P/E) and price-to-book value (P/BV) ratios remain elevated compared to peers, prompting a downgrade in its Mojo Grade from Hold to Sell on 19 June 2026.
Read full news article Announcements
Announcement Under Regulation 30(LODR) For Increase In The Volume
15-Jun-2026 | Source : BSEReply letter for Query mail received on 15.06.2026 regarding increase in the volume
Clarification sought from Jindal Worldwide Ltd
15-Jun-2026 | Source : BSEThe Exchange has sought clarification from Jindal Worldwide Ltd on June 15 2026 with reference to Movement in Volume.
The reply is awaited.
Compliances-Reg.24(A)-Annual Secretarial Compliance
26-May-2026 | Source : BSEAnnual Secretarial Compliance Report for the Year ended 31st March 2026
Corporate Actions

No Upcoming Board Meetings

Jindal Worldwide Ltd has declared 20% dividend, ex-date: 09 Sep 24

Jindal Worldwide Ltd has announced 1:5 stock split, ex-date: 31 Oct 18

Jindal Worldwide Ltd has announced 4:1 bonus issue, ex-date: 28 Feb 25

No Rights history available
Quality key factors
Valuation key factors
Technicals key factors
 Technical Indicator Scale: Bearish, Mildly Bearish, Sideways, Mildly Bullish, Bullish Turned
 Shareholding Snapshot : Mar 2026
Shareholding Compare (%holding)
Promoters
24.094
Held by 1 Schemes (0.0%)
Held by 12 FIIs (0.16%)
Amit Yamunadutt Agarwal (19.4%)
Saroj Kailash Agrawal (12.95%)
20.54%
Quarterly Results Snapshot (Consolidated) - Mar'26 - YoY

YoY Growth in quarter ended Mar 2026 is 5.72% vs 5.53% in Mar 2025
YoY Growth in quarter ended Mar 2026 is 18.66% vs -21.83% in Mar 2025
Half Yearly Results Snapshot (Consolidated) - Sep'25

Growth in half year ended Sep 2025 is 5.20% vs 31.86% in Sep 2024
Growth in half year ended Sep 2025 is -17.09% vs 33.84% in Sep 2024
Nine Monthly Results Snapshot (Consolidated) - Dec'25
YoY Growth in nine months ended Dec 2025 is -2.21% vs 35.66% in Dec 2024
YoY Growth in nine months ended Dec 2025 is -18.89% vs 13.42% in Dec 2024
Annual Results Snapshot (Consolidated) - Mar'26
YoY Growth in year ended Mar 2026 is -0.11% vs 26.13% in Mar 2025
YoY Growth in year ended Mar 2026 is -7.62% vs -0.11% in Mar 2025
About Jindal Worldwide Ltd

Company Coordinates


