Ganesha Ecosphe.

  • Market Cap: Small Cap
  • Industry: Garments & Apparels
  • ISIN: INE845D01014
  • NSEID: GANECOS
  • BSEID: 514167
INR
1,005.90
-8.85 (-0.87%)
BSENSE

Sep 15, 03:32 PM

BSE+NSE Vol: 83.72 k

  • Price Points
  • Score
  • Mojo Parameters
  • Total Return
  • News and Corporate Actions
  • Key factors
  • Shareholding
  • Financials
  • CompanyCV
stock-summaryPrice Point
High/Low

1Day

52 Week

Valuation
Technical
Day's Volume

CASH

83.72 k (-24.80%) Volume

Shareholding (Jun 2026)

FII

10.38%

Held by 45 FIIs

DII

15.07%

Held by 16 DIIs

Promoter

39.33%

Why is Ganesha Ecosphere Ltd falling/rising?

06-Sep-2026

As of 05-Sep, Ganesha Ecosphere Ltd's stock price is declining, currently at Rs 998.15, down 2.35%, with significant drops over the past week and month. Despite positive financial results, the stock is underperforming and experiencing reduced investor interest.

As of 05-Sep, Ganesha Ecosphere Ltd's stock price is falling, currently at Rs 998.15, which reflects a decrease of Rs 24.05 or 2.35%. The stock has underperformed compared to the benchmark Sensex, which has only declined by 0.97% over the same period. In the last week, the stock has dropped by 1.81%, and over the past month, it has seen a significant decline of 11.43%. <BR><BR>Today's trading session has been particularly challenging, with the stock touching an intraday low of Rs 962.35, marking a decrease of 5.86%. The weighted average price indicates that more volume was traded closer to this low price, suggesting a lack of buyer interest at higher levels. Additionally, there has been a notable decrease in investor participation, with delivery volume on September 3 falling by 35.69% compared to the five-day average. <BR><BR>While there have been positive financial results reported, such as a substantial growth in profit after tax and net sales, these have not translated into positive stock performance in the short term. The stock is currently trading above its 200-day moving average but below its shorter-term moving averages, indicating mixed signals. Overall, the combination of declining stock performance, reduced investor participation, and underperformance relative to the sector contributes to the current downward trend in Ganesha Ecosphere Ltd's stock price.

View full answer

Who are in the management team of Ganesha Ecosphe.?

01-Sep-2026

The management team of Ganesha Ecosphe includes Shyam S Sharma (Chairman), V D Khandelwal (Vice Chairman), Sharad Sharma (CEO), Rajesh Sharma (Joint MD), and four Independent Non-Executive Directors: Pradeep Kumar Goenka, Abhilash Lal, Sobha Chaturvedi, and N Subramaniam. They are responsible for the company's strategic direction and operations.

The management team of Ganesha Ecosphe includes the following individuals:<BR><BR>1. **Shyam S Sharma** - Chairman & Non-Executive Director<BR>2. **V D Khandelwal** - Vice Chairman & Executive Director<BR>3. **Sharad Sharma** - Executive Director / Managing Director / CEO / Promoter<BR>4. **Rajesh Sharma** - Executive Director / Joint Managing Director / Promoter<BR>5. **Pradeep Kumar Goenka** - Independent Non-Executive Director<BR>6. **Abhilash Lal** - Independent Non-Executive Director<BR>7. **Sobha Chaturvedi** - Independent Non-Executive Director<BR>8. **N Subramaniam** - Independent Non-Executive Director<BR><BR>This team plays a crucial role in guiding the company's strategic direction and operations.

View full answer

What does Ganesha Ecosphe. do?

01-Sep-2026

Ganesha Ecosphere Ltd is a leading PET waste recycling company in India, specializing in the Garments & Apparels industry. As of June 2026, it reported net sales of ₹424 Cr and a net profit of ₹29 Cr, with a market cap of ₹2,737 Cr.

Overview: <BR>Ganesha Ecosphere Ltd is a leading PET waste recycling company in India, operating in the Garments & Apparels industry within the small-cap market segment.<BR><BR>History: <BR>The company was incorporated on October 30, 1987, originally named 'Ganesh Polytex Limited', and changed its name to 'Ganesha Ecosphere Limited' on October 7, 2011. The latest quarterly results reported net sales and profit for June 2026.<BR><BR>Financial Snapshot: <BR>Net Sales: 424 Cr (Quarterly Results - Jun 2026) <BR>Net Profit: 29 Cr (Quarterly Results - Jun 2026) <BR>Market Cap: INR 2,737 Cr (Small Cap)<BR><BR>Key Metrics: <BR>P/E: 49.00 <BR>Industry P/E: 28 <BR>Dividend Yield: 0.30% <BR>Debt-Equity: 0.29 <BR>Return on Equity: 3.00% <BR>Price to Book: 2.13<BR><BR>Contact Details: <BR>Address: Raipur(Rania), Kalpi Road Kanpur Uttar Pradesh : 248008 <BR>Tel: 91-512-2555505-06/+9198708383 <BR>Email: gesl@ganeshaecosphere.com <BR>Website: http://www.ganeshaecosphere.com

View full answer

Who are the peers of the Ganesha Ecosphe.?

01-Sep-2026

Ganesha Ecosphe.'s peers include Filatex India, Kewal Kir.Cloth., Baazar Style, Sangam India, Sportking India, SP Apparels, Siyaram Silk, Kitex Garments, Bombay Dyeing, and Cantabil Retail. Ganesha Ecosphe. has an average management risk, below average growth, and a 1-year return of -23.02%, higher than Kitex Garments but lower than its other peers.

Peers: The peers of Ganesha Ecosphe. are Filatex India, Kewal Kir.Cloth., Baazar Style, Sangam India, Sportking India, SP Apparels, Siyaram Silk, Kitex Garments, Bombay Dyeing, and Cantabil Retail.<BR><BR>Quality Snapshot: Excellent management risk is observed at Kewal Kir.Cloth. and Siyaram Silk, while Average management risk is found at Filatex India, Sangam India, Sportking India, Ganesha Ecosphe., SP Apparels, and Bombay Dyeing, and the rest. Growth is Excellent at Kewal Kir.Cloth. and Average at Siyaram Silk, while Below Average growth is noted at Filatex India, Baazar Style, Sangam India, Sportking India, Ganesha Ecosphe., SP Apparels, Kitex Garments, and Bombay Dyeing, and the rest. Excellent capital structure is seen at Kewal Kir.Cloth. and Siyaram Silk, while Ganesha Ecosphe., Filatex India, Sportking India, and Kitex Garments have Average capital structure, and the rest have Below Average.<BR><BR>Return Snapshot: The peer with the highest 1-year return is Sportking India at 113.93%, while the lowest is Kitex Garments at -28.88%. Ganesha Ecosphe.'s 1-year return is -23.02%, which is higher than Kitex Garments but lower than all other peers. Additionally, Kitex Garments and Bombay Dyeing have negative six-month returns.

View full answer

How big is Ganesha Ecosphe.?

01-Sep-2026

As of 31st August, Ganesha Ecosphere Ltd has a market capitalization of 2,737.00 Cr, with net sales of 1,568.21 Cr and a net profit of 56.49 Cr reported in the latest four quarters. The company has shareholder's funds of 1,275.67 Cr and total assets of 2,003.38 Cr for the annual period ending March 2026.

As of 31st August, Ganesha Ecosphere Ltd has a market capitalization of 2,737.00 Cr, categorizing it as a Small Cap company.<BR><BR>In the latest four quarters, Ganesha Ecosphere reported net sales of 1,568.21 Cr and a net profit of 56.49 Cr.<BR><BR>For the latest annual period ending in March 2026, the company reported shareholder's funds of 1,275.67 Cr and total assets of 2,003.38 Cr.

View full answer

Are Ganesha Ecosphere Ltd latest results good or bad?

04-Aug-2026

Ganesha Ecosphere Ltd's Q1 FY27 results are strong, with a 170.05% increase in net profit and a 25.67% rise in revenue year-on-year, but the stock has underperformed by 22.98% over the past year and has a high price-to-earnings ratio, indicating potential overvaluation concerns.

Ganesha Ecosphere Ltd's latest results for Q1 FY27 can be considered quite strong overall. The company reported a net profit of ₹29.03 crores, which marks a remarkable 170.05% increase year-on-year. Additionally, revenue grew by 25.67% compared to the same quarter last year, reaching ₹423.67 crores, although it showed a slight decline of 0.06% from the previous quarter.<BR><BR>The operating margin also improved significantly, reaching 14.11%, the highest in seven quarters, indicating better operational efficiency. Furthermore, the earnings per share (EPS) hit a quarterly peak of ₹10.83.<BR><BR>However, despite these impressive quarterly results, the stock has underperformed over the past year, declining by 22.98%, which is significantly worse than the broader market. The valuation remains a concern, with a high price-to-earnings ratio of 80.79 times trailing earnings, suggesting that the stock may be overvalued relative to its earnings potential.<BR><BR>In summary, while the quarterly results reflect strong operational performance and profitability, the stock's valuation and historical underperformance raise caution for investors.

View full answer

Should I buy, sell or hold Ganesha Ecosphere Ltd?

04-Aug-2026

When is the next results date for Ganesha Ecosphere Ltd?

28-Jul-2026

The next results date for Ganesha Ecosphere Ltd is August 3, 2026.

The next results date for Ganesha Ecosphere Ltd is scheduled for August 3, 2026.

View full answer

Is Ganesha Ecosphe. overvalued or undervalued?

24-Nov-2025

As of November 21, 2025, Ganesha Ecosphe is considered overvalued with a PE ratio of 35.07 and a year-to-date return of -58.58%, indicating weaker growth prospects compared to its peers.

As of 21 November 2025, the valuation grade for Ganesha Ecosphe. has moved from very attractive to attractive. The company appears to be overvalued given its current metrics, particularly when compared to its peers. The PE ratio stands at 35.07, while the EV to EBITDA ratio is 16.06, and the PEG ratio is notably at 0.00, indicating a lack of growth expectations. <BR><BR>In comparison, K P R Mill Ltd, which is categorized as very expensive, has a PE ratio of 44.13, while Trident, rated as fair, has a PE ratio of 32.58. This suggests that Ganesha Ecosphe. is priced higher than some of its fair-valued peers despite its lower growth prospects. Additionally, the company's stock has underperformed significantly against the Sensex, with a year-to-date return of -58.58% compared to the Sensex's 9.08%. Overall, Ganesha Ecosphe. is currently overvalued in the market.

View full answer

How has been the historical performance of Ganesha Ecosphe.?

12-Nov-2025

Ganesha Ecosphe has shown significant growth, with net sales increasing from 751.14 Cr in Mar'21 to 1,465.54 Cr in Mar'25, and profit after tax rising from 43.52 Cr to 103.17 Cr in the same period. The company's total assets grew from 665.59 Cr to 1,934.20 Cr, reflecting strong operational efficiency despite rising raw material costs.

Answer:<BR>The historical performance of Ganesha Ecosphe shows significant growth in various financial metrics over the years.<BR><BR>Breakdown:<BR>Ganesha Ecosphe's net sales have increased from 751.14 Cr in Mar'21 to 1,465.54 Cr in Mar'25, reflecting a strong upward trend. Total operating income followed a similar trajectory, rising from 888.83 Cr in Mar'20 to 1,465.54 Cr in Mar'25. However, raw material costs also surged, reaching 904.16 Cr in Mar'25 from 460.36 Cr in Mar'21. Despite this, the operating profit (PBDIT) improved significantly, climbing to 228.52 Cr in Mar'25 from 93.93 Cr in Mar'21, indicating better operational efficiency. Profit before tax also saw a notable increase, rising to 135.47 Cr in Mar'25 from 57.95 Cr in Mar'21, while profit after tax reached 103.17 Cr in Mar'25, up from 43.52 Cr in Mar'21. The company's total assets grew from 665.59 Cr in Mar'20 to 1,934.20 Cr in Mar'25, and total liabilities increased from 747.26 Cr to 1,934.20 Cr in the same period. Cash flow from operating activities showed fluctuations but ended positively at 41.00 Cr in Mar'25, while net cash inflow rose to 72.00 Cr. Overall, Ganesha Ecosphe has demonstrated robust growth in sales, profits, and asset base over the years.

View full answer

How has been the historical performance of Ganesha Ecosphe.?

12-Nov-2025

Ganesha Ecosphe has shown significant financial growth, with net sales increasing from 751.14 Cr in Mar'21 to 1,465.54 Cr in Mar'25, and profit after tax rising from 43.52 Cr to 103.17 Cr during the same period. The company's total assets grew from 665.59 Cr to 1,934.20 Cr, reflecting robust performance and improved profitability.

Answer:<BR>The historical performance of Ganesha Ecosphe shows significant growth in various financial metrics over the years.<BR><BR>Breakdown:<BR>Ganesha Ecosphe has demonstrated a strong upward trend in net sales, increasing from 751.14 Cr in Mar'21 to 1,465.54 Cr in Mar'25. Total operating income followed a similar trajectory, rising from 888.83 Cr in Mar'20 to 1,465.54 Cr in Mar'25. However, raw material costs also increased, reaching 894.16 Cr in Mar'25, which reflects the company's growing operational scale. Operating profit (PBDIT) has improved notably, from 93.93 Cr in Mar'21 to 228.52 Cr in Mar'25, indicating enhanced profitability. Profit before tax surged from 57.95 Cr in Mar'21 to 135.47 Cr in Mar'25, while profit after tax rose from 43.52 Cr to 103.17 Cr in the same period. The earnings per share (EPS) also saw a substantial increase, climbing from 19.94 in Mar'21 to 40.5 in Mar'25. On the balance sheet, total assets grew from 665.59 Cr in Mar'20 to 1,934.20 Cr in Mar'25, with total liabilities increasing from 398.79 Cr to 556.15 Cr. The company maintained a healthy book value per share, which rose from 218.73 in Mar'20 to 438.39 in Mar'25. Cash flow from operating activities showed fluctuations but ended positively at 41.00 Cr in Mar'25, contributing to a net cash inflow of 72.00 Cr for the year. Overall, Ganesha Ecosphe's financial performance reflects robust growth and improved profitability over the years.

View full answer

Is Ganesha Ecosphe. technically bullish or bearish?

21-Oct-2025

As of October 20, 2025, the technical trend is bearish with moderate strength, driven by bearish MACD, moving averages, and KST, despite a bullish weekly RSI, indicating significant underperformance compared to the Sensex.

As of 20 October 2025, the technical trend has changed from mildly bearish to bearish. The current stance is bearish with moderate strength. Key indicators driving this stance include the bearish MACD on the weekly chart and the bearish daily moving averages. The weekly KST is also bearish, while the Bollinger Bands indicate a mildly bearish trend. Although the weekly RSI shows bullishness, it is overshadowed by the overall bearish signals in the other indicators. The stock has underperformed significantly compared to the Sensex over various time frames, further supporting the bearish outlook.

View full answer

Who are the top shareholders of the Ganesha Ecosphe.?

06-Jun-2025

The top shareholders of Ganesha Ecosphe include promoters led by Gpl Finance Ltd with 9.13%, mutual funds holding 21.26%, 66 foreign institutional investors with 10.36%, and individual investors owning 22.04%. The largest public shareholder is SBI Mutual Fund at 9.38%.

The top shareholders of Ganesha Ecosphe include a mix of promoters, mutual funds, foreign institutional investors (FIIs), and individual investors. The majority shareholders are the promoters, with Gpl Finance Ltd holding the highest stake among them at 9.13%. <BR><BR>In terms of mutual funds, 15 schemes collectively hold 21.26% of the company, while 66 FIIs own 10.36%. The highest public shareholder is SBI Mutual Fund, which has a stake of 9.38%. Individual investors collectively hold 22.04% of the shares.

View full answer

Has Ganesha Ecosphe. declared dividend?

06-Jun-2025

Ganesha Ecosphere Ltd has declared a 15% dividend, amounting to ₹1.5 per share, with an ex-date of November 26, 2024. While recent short-term returns have been volatile, long-term performance shows significant growth, particularly in price appreciation.

Ganesha Ecosphere Ltd has declared a 15% dividend.<BR><BR>Dividend Details:<BR>- Percentage announced: 15%<BR>- Amount per share: 1.5<BR>- Ex-date: 26 Nov 24<BR><BR>Dividend Yield: 0.3%.<BR><BR>Total Returns by Period:<BR>Over the 6-month period, the price return was -33.75%, with a dividend return of 0%, resulting in a total return of -33.75%.<BR><BR>In the 1-year period, the price return was 27.66%, the dividend return was 0.36%, leading to a total return of 28.02%.<BR><BR>For the 2-year period, the price return was 44.4%, the dividend return was 0.61%, resulting in a total return of 45.01%.<BR><BR>During the 3-year period, the price return was 136.61%, with a dividend return of 1.51%, culminating in a total return of 138.12%.<BR><BR>In the 4-year period, the price return was 164.94%, the dividend return was 2.02%, leading to a total return of 166.96%.<BR><BR>Over the 5-year period, the price return was 697.04%, with a dividend return of 5.79%, resulting in a total return of 702.83%.<BR><BR>Overall, Ganesha Ecosphere Ltd has declared a dividend, and while the recent returns over shorter periods show volatility, the longer-term returns indicate significant growth, particularly in price appreciation.

View full answer
iScoreScore
Click here to find our call on this stock
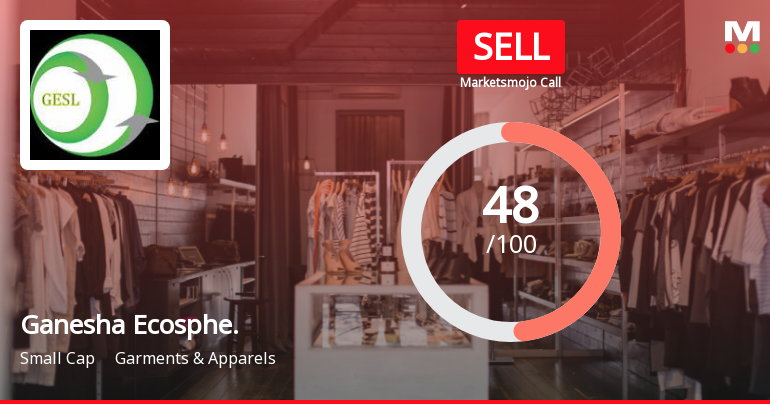
Strong Sell
Sell
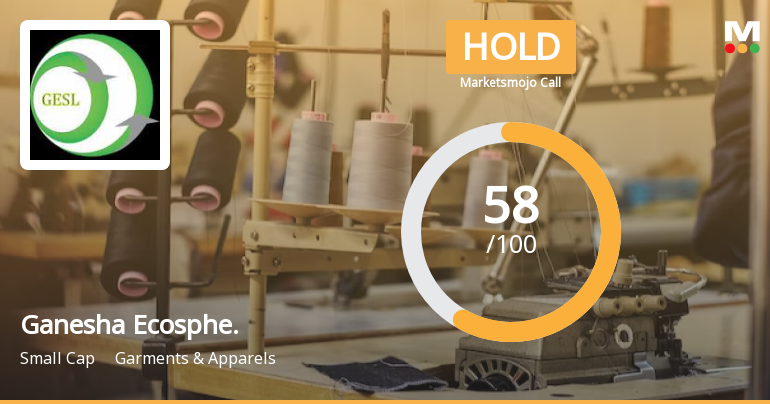
Hold
Buy
Strong Buy

Dashboard

1

Poor long term growth as Net Sales has grown by an annual rate of 12.24% and Operating profit at 3.49% over the last 5 years

 
2

With ROCE of 4.7, it has a Expensive valuation with a 1.9 Enterprise value to Capital Employed

3

31.87% of Promoter Shares are Pledged

4

Underperformed the market in the last 1 year

stock-summaryMojo Parameters

Mojo Parameters

Loading Valuation Snapshot...

Stock DNA

stock-summary
Industry

Garments & Apparels

stock-summary
Market cap

INR 2,714 Cr (Small Cap)

stock-summary
P/E

48.00

stock-summary
Industry P/E

28

stock-summary
Dividend Yield

0.64%

stock-summary
Debt Equity

0.29

stock-summary
Return on Equity

3.00%

stock-summary
Price to Book

2.13

Revenue and Profits:
Net Sales:
424 Cr
(Quarterly Results - Jun 2026)
Net Profit:
29 Cr
stock-summaryTotal Returns
Total Returns (Price + Dividend) stock-summary
Dividend Yield (0.64%)
TimePeriod
Price Return
Dividend Return
Total Return
3 Months
8.27%
0.38%
8.65%
6 Months
27.79%
0.43%
28.22%
1 Year
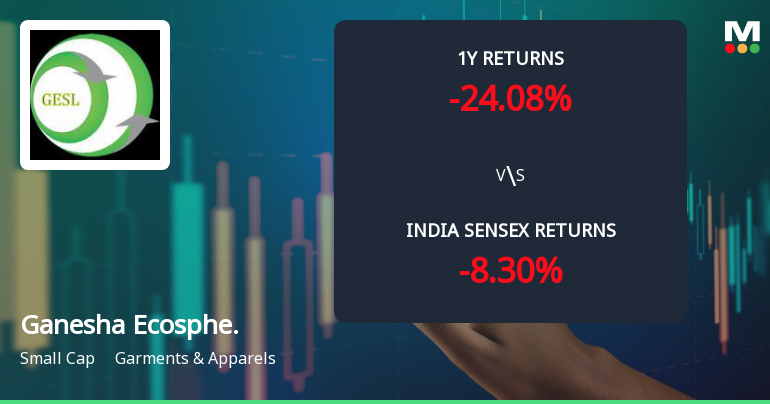
-23.11%
0.28%
-22.83%
2 Years
-48.02%
0.43%
-47.59%
3 Years
0.04%
1.14%
1.18%
4 Years
56.63%
1.96%
58.59%
5 Years
103.54%
3.04%
106.58%

Latest dividend: 3.541877744005404 per share ex-dividend date: Sep-10-2026

Risk Adjusted Returns v/s stock-summary
Returns Beta
Icon
Beta has not been calculated since enough price history is not available
stock-summaryNews & Corporate Actions

News

Announcements stock-summary

Announcement under Regulation 30 (LODR)-Newspaper Publication

27-Aug-2026 | Source : BSE

Submission of newspaper clippings regarding Notice of 37TH Annual General Meeting Book Closure and E-Voting information.

Notice Of 37Th AGM And Annual Report.

26-Aug-2026 | Source : BSE

As per the Attachment.

Intimation Of Cut-Off Date For E-Voting

26-Aug-2026 | Source : BSE

As per the attached file

Corporate Actions stock-summary

stock-summary
BOARD MEETING

No Upcoming Board Meetings

stock-summary
DIVIDEND

Ganesha Ecosphere Ltd has declared 35% dividend, ex-date: 10 Sep 26

stock-summary
SPLITS

No Splits history available

stock-summary
BONUS

No Bonus history available

stock-summary
RIGHTS

No Rights history available

stock-summaryKey Factors

Quality key factors stock-summary

Factor
Value
Sales Growth (5y)
12.24%
EBIT Growth (5y)
3.49%
EBIT to Interest (avg)
4.36
Debt to EBITDA (avg)
3.15
Net Debt to Equity (avg)
0.29
Sales to Capital Employed (avg)
0.94
Tax Ratio
26.37%
Dividend Payout Ratio
11.11%
Pledged Shares
31.87%
Institutional Holding
25.45%
ROCE (avg)
8.71%
ROE (avg)
8.38%

Valuation key factors

Factor
Value
P/E Ratio
48
Industry P/E
28
Price to Book Value
2.13
EV to EBIT
31.33
EV to EBITDA
18.69
EV to Capital Employed
1.88
EV to Sales
1.97
PEG Ratio
NA
Dividend Yield
0.64%
ROCE (Latest)
4.68%
ROE (Latest)
3.00%

Technicals key factors

Indicator
Weekly
Monthly
MACD
Mildly Bearish
Mildly Bullish
RSI
No Signal
No Signal
Bollinger Bands
Mildly Bearish
Bearish
Moving Averages
Mildly Bullish (Daily)
KST
Mildly Bearish
Bearish
Dow Theory
Mildly Bearish
Mildly Bullish
OBV
Mildly Bearish
Bullish
stock-summary Technical Indicator Scale: Bearish, Mildly Bearish, Sideways, Mildly Bullish, Bullish  Turned 
stock-summaryShareholding
Shareholding Snapshot : Jun 2026stock-summary
Shareholding Compare (%holding) stock-summary
Majority shareholders

Promoters

Pledged Promoter Holdings

31.868

Mutual Funds

Held by 11 Schemes (14.75%)

FIIs

Held by 45 FIIs (10.38%)

Promoter with highest holding

Gpl Finance Ltd (13.67%)

Highest Public shareholder

Sbi Mutual Fund (5.88%)

Individual Investors Holdings

22.86%

stock-summaryFinancial
[
  {
    "link": "quarterly",
    "btn_text": "All Quarterly Results",
    "header": "Quarterly Results Snapshot (Consolidated) - Jun'26 - QoQ",
    "rhs": [
      {
        "prefix": "Net Sales ",
        "suffix": "QoQ Growth in quarter ended Jun 2026 is -0.06% vs 18.68% in Mar 2026",
        "dir": -1
      },
      {
        "prefix": "Consolidated Net Profit ",
        "suffix": "QoQ Growth in quarter ended Jun 2026 is 25.08% vs 388.63% in Mar 2026",
        "dir": -1
      }
    ],
    "table": {
      "header": [
        "Jun'26",
        "Mar'26",
        "Change(%)"
      ],
      "body": [
        {
          "field": "Net Sales",
          "val1": "423.67",
          "val2": "423.94",
          "chgp": "-0.06%",
          "chgp_class": "negative"
        },
        {
          "field": "Operating Profit (PBDIT) excl Other Income",
          "val1": "59.78",
          "val2": "52.35",
          "chgp": "14.19%",
          "chgp_class": "positive"
        },
        {
          "field": "Interest",
          "val1": "8.87",
          "val2": "8.79",
          "chgp": "0.91%",
          "chgp_class": "negative"
        },
        {
          "field": "Exceptional Items",
          "val1": "0.00",
          "val2": "0.00",
          "chgp": "",
          "chgp_class": "neutral"
        },
        {
          "field": "Consolidate Net Profit",
          "val1": "29.03",
          "val2": "23.21",
          "chgp": "25.08%",
          "chgp_class": "positive"
        },
        {
          "field": "Operating Profit Margin (Excl OI)",
          "val1": "14.11%",
          "val2": "12.35%",
          "chgp": "1.76%",
          "chgp_class": "positive"
        }
      ]
    }
  },
  {
    "link": "half-yearly",
    "btn_text": "All Half Yearly Results",
    "header": "Half Yearly Results Snapshot (Consolidated) - Sep'25",
    "rhs": [
      {
        "prefix": "Net Sales ",
        "suffix": " Growth in half year ended Sep 2025 is -3.16% vs 35.82% in Sep 2024",
        "dir": -1
      },
      {
        "prefix": "Consolidated Net Profit ",
        "suffix": " Growth in half year ended Sep 2025 is -79.36% vs 694.56% in Sep 2024",
        "dir": -1
      }
    ],
    "table": {
      "header": [
        "Sep'25",
        "Sep'24",
        "Change(%)"
      ],
      "body": [
        {
          "field": "Net Sales",
          "val1": "700.51",
          "val2": "723.36",
          "chgp": "-3.16%",
          "chgp_class": "negative"
        },
        {
          "field": "Operating Profit (PBDIT) excl Other Income",
          "val1": "58.63",
          "val2": "102.98",
          "chgp": "-43.07%",
          "chgp_class": "negative"
        },
        {
          "field": "Interest",
          "val1": "21.13",
          "val2": "17.91",
          "chgp": "17.98%",
          "chgp_class": "negative"
        },
        {
          "field": "Exceptional Items",
          "val1": "0.00",
          "val2": "0.00",
          "chgp": "",
          "chgp_class": "neutral"
        },
        {
          "field": "Consolidate Net Profit",
          "val1": "10.25",
          "val2": "49.66",
          "chgp": "-79.36%",
          "chgp_class": "negative"
        },
        {
          "field": "Operating Profit Margin (Excl OI)",
          "val1": "8.37%",
          "val2": "14.24%",
          "chgp": "-5.87%",
          "chgp_class": "negative"
        }
      ]
    }
  },
  {
    "link": "nine-monthly",
    "btn_text": "All Nine Monthly Results",
    "header": "Nine Monthly Results Snapshot (Consolidated) - Dec'25",
    "rhs": [
      {
        "prefix": "Net Sales ",
        "suffix": "YoY Growth in nine months ended Dec 2025 is -5.66% vs 37.16% in Dec 2024",
        "dir": -1
      },
      {
        "prefix": "Consolidated Net Profit ",
        "suffix": "YoY Growth in nine months ended Dec 2025 is -81.10% vs 318.18% in Dec 2024",
        "dir": -1
      }
    ],
    "table": {
      "header": [
        "Dec'25",
        "Dec'24",
        "Change(%)"
      ],
      "body": [
        {
          "field": "Net Sales",
          "val1": "1,057.73",
          "val2": "1,121.16",
          "chgp": "-5.66%",
          "chgp_class": "negative"
        },
        {
          "field": "Operating Profit (PBDIT) excl Other Income",
          "val1": "89.36",
          "val2": "159.48",
          "chgp": "-43.97%",
          "chgp_class": "negative"
        },
        {
          "field": "Interest",
          "val1": "31.53",
          "val2": "28.44",
          "chgp": "10.86%",
          "chgp_class": "negative"
        },
        {
          "field": "Exceptional Items",
          "val1": "0.00",
          "val2": "0.00",
          "chgp": "",
          "chgp_class": "neutral"
        },
        {
          "field": "Consolidate Net Profit",
          "val1": "15.00",
          "val2": "79.37",
          "chgp": "-81.10%",
          "chgp_class": "negative"
        },
        {
          "field": "Operating Profit Margin (Excl OI)",
          "val1": "8.45%",
          "val2": "14.22%",
          "chgp": "-5.77%",
          "chgp_class": "negative"
        }
      ]
    }
  },
  {
    "link": "annual",
    "btn_text": "All Annual Results",
    "header": "Annual Results Snapshot (Consolidated) - Mar'26",
    "rhs": [
      {
        "prefix": "Net Sales ",
        "suffix": "YoY Growth in year ended Mar 2026 is 1.10% vs 30.51% in Mar 2025",
        "dir": -1
      },
      {
        "prefix": "Consolidated Net Profit ",
        "suffix": "YoY Growth in year ended Mar 2026 is -62.95% vs 154.18% in Mar 2025",
        "dir": -1
      }
    ],
    "table": {
      "header": [
        "Mar'26",
        "Mar'25",
        "Change(%)"
      ],
      "body": [
        {
          "field": "Net Sales",
          "val1": "1,481.66",
          "val2": "1,465.54",
          "chgp": "1.10%",
          "chgp_class": "positive"
        },
        {
          "field": "Operating Profit (PBDIT) excl Other Income",
          "val1": "141.71",
          "val2": "210.58",
          "chgp": "-32.70%",
          "chgp_class": "negative"
        },
        {
          "field": "Interest",
          "val1": "40.32",
          "val2": "38.09",
          "chgp": "5.85%",
          "chgp_class": "negative"
        },
        {
          "field": "Exceptional Items",
          "val1": "0.00",
          "val2": "0.00",
          "chgp": "",
          "chgp_class": "neutral"
        },
        {
          "field": "Consolidate Net Profit",
          "val1": "38.21",
          "val2": "103.12",
          "chgp": "-62.95%",
          "chgp_class": "negative"
        },
        {
          "field": "Operating Profit Margin (Excl OI)",
          "val1": "9.56%",
          "val2": "14.37%",
          "chgp": "-4.81%",
          "chgp_class": "negative"
        }
      ]
    }
  }
]

Quarterly Results Snapshot (Consolidated) - Jun'26 - QoQstock-summary

Jun'26
Mar'26
Change(%)
Net Sales
423.67
423.94
-0.06%
Operating Profit (PBDIT) excl Other Income
59.78
52.35
14.19%
Interest
8.87
8.79
0.91%
Exceptional Items
0.00
0.00
Consolidate Net Profit
29.03
23.21
25.08%
Operating Profit Margin (Excl OI)
14.11%
12.35%
1.76%
Values in Rs Cr.
Direction Arrows
Net Sales

QoQ Growth in quarter ended Jun 2026 is -0.06% vs 18.68% in Mar 2026

Direction Arrows
Consolidated Net Profit

QoQ Growth in quarter ended Jun 2026 is 25.08% vs 388.63% in Mar 2026

Half Yearly Results Snapshot (Consolidated) - Sep'25stock-summary

Sep'25
Sep'24
Change(%)
Net Sales
700.51
723.36
-3.16%
Operating Profit (PBDIT) excl Other Income
58.63
102.98
-43.07%
Interest
21.13
17.91
17.98%
Exceptional Items
0.00
0.00
Consolidate Net Profit
10.25
49.66
-79.36%
Operating Profit Margin (Excl OI)
8.37%
14.24%
-5.87%
Values in Rs Cr.
Direction Arrows
Net Sales

Growth in half year ended Sep 2025 is -3.16% vs 35.82% in Sep 2024

Direction Arrows
Consolidated Net Profit

Growth in half year ended Sep 2025 is -79.36% vs 694.56% in Sep 2024

Nine Monthly Results Snapshot (Consolidated) - Dec'25stock-summary

Dec'25
Dec'24
Change(%)
Net Sales
1,057.73
1,121.16
-5.66%
Operating Profit (PBDIT) excl Other Income
89.36
159.48
-43.97%
Interest
31.53
28.44
10.86%
Exceptional Items
0.00
0.00
Consolidate Net Profit
15.00
79.37
-81.10%
Operating Profit Margin (Excl OI)
8.45%
14.22%
-5.77%
Values in Rs Cr.
Direction Arrows
Net Sales

YoY Growth in nine months ended Dec 2025 is -5.66% vs 37.16% in Dec 2024

Direction Arrows
Consolidated Net Profit

YoY Growth in nine months ended Dec 2025 is -81.10% vs 318.18% in Dec 2024

Annual Results Snapshot (Consolidated) - Mar'26stock-summary

Mar'26
Mar'25
Change(%)
Net Sales
1,481.66
1,465.54
1.10%
Operating Profit (PBDIT) excl Other Income
141.71
210.58
-32.70%
Interest
40.32
38.09
5.85%
Exceptional Items
0.00
0.00
Consolidate Net Profit
38.21
103.12
-62.95%
Operating Profit Margin (Excl OI)
9.56%
14.37%
-4.81%
Values in Rs Cr.
Direction Arrows
Net Sales

YoY Growth in year ended Mar 2026 is 1.10% vs 30.51% in Mar 2025

Direction Arrows
Consolidated Net Profit

YoY Growth in year ended Mar 2026 is -62.95% vs 154.18% in Mar 2025

stock-summaryCompany CV
About Ganesha Ecosphere Ltd stock-summary
stock-summary
Ganesha Ecosphere Ltd
Small Cap
Garments & Apparels
Ganesha Ecosphere Limited was incorporated on October 30, 1987 with the name 'Ganesh Polytex Limited', which subsequently got changed from 'Ganesh Polytex Limited' to 'Ganesha Ecosphere Limited' from October 7, 2011. The Company is a leading PET Waste recycling company in India and is engaged in the manufacturing of Recycled Polyester Staple Fibre (RPSF), Spun Yarn and Dyed Texturised Yarn. It operate three units located at Kanpur (U.P.
Company Coordinates stock-summary
Company Details
Raipur(Rania), Kalpi Road Kanpur Uttar Pradesh : 248008
stock-summary
Tel: 91-512-2555505-06/+9198708383
stock-summary
gesl@ganeshaecosphere.com
Registrar Details
Skyline Financial Services Pvt Ltd , D-153/A, 1st Floor, Okhla Industrial Area, Phase - I, New Delhi