
Compare RACL Geartech with Similar Stocks
Dashboard
Low ability to service debt as the company has a high Debt to EBITDA ratio of 2.27 times
- Low ability to service debt as the company has a high Debt to EBITDA ratio of 2.27 times
Poor long term growth as Operating profit has grown by an annual rate 15.23% of over the last 5 years
The company has declared Positive results for the last 3 consecutive quarters
With ROCE of 12.2, it has a Expensive valuation with a 3.1 Enterprise value to Capital Employed
Increasing Participation by Institutional Investors
Stock DNA
Auto Components & Equipments
INR 1,568 Cr (Micro Cap)
32.00
37
0.09%
0.63
13.94%
4.46
Total Returns (Price + Dividend) 
Latest dividend: 1.5028118096003213 per share ex-dividend date: Feb-20-2026
Risk Adjusted Returns v/s
Returns Beta

News
RACL Geartech Ltd is Rated Hold by MarketsMOJO
RACL Geartech Ltd is rated 'Hold' by MarketsMOJO, with this rating last updated on 27 May 2026. However, the analysis and financial metrics discussed here reflect the stock's current position as of 17 June 2026, providing investors with an up-to-date view of the company’s fundamentals, returns, and market standing.
Read full news article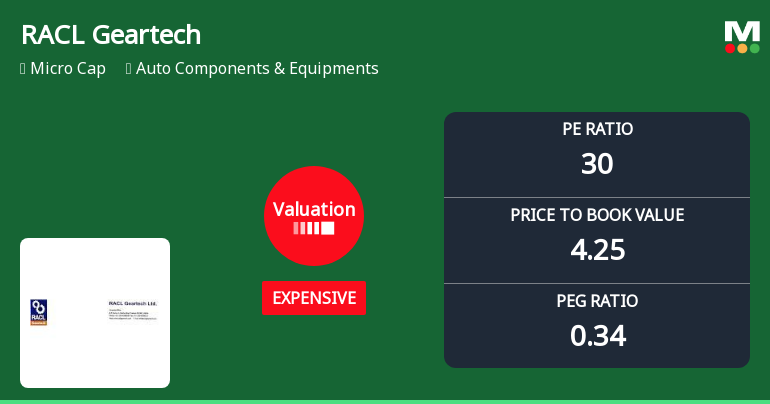
RACL Geartech Ltd Valuation Shifts Signal Changing Market Sentiment
RACL Geartech Ltd, a micro-cap player in the Auto Components & Equipments sector, has seen its valuation parameters shift notably, prompting a downgrade in its investment grade from Buy to Hold. With its price-to-earnings (P/E) ratio rising to 30.48 and price-to-book value (P/BV) at 4.25, the stock now trades at a premium compared to its historical averages and many peers, raising questions about its price attractiveness despite solid returns over the past year and longer horizons.
Read full news article
RACL Geartech Ltd is Rated Hold by MarketsMOJO
RACL Geartech Ltd is currently rated 'Hold' by MarketsMOJO, with this rating last updated on 27 May 2026. While the rating change occurred on that date, the analysis and financial metrics discussed here reflect the stock's current position as of 08 June 2026, providing investors with the latest insights into the company’s performance and outlook.
Read full news article Announcements
Announcement under Regulation 30 (LODR)-Earnings Call Transcript
17-Jun-2026 | Source : BSEEnclosed is the transcript of the conference call held on June 12 2026
Announcement under Regulation 30 (LODR)-Newspaper Publication
16-Jun-2026 | Source : BSEEnclosed are the copies of the newspaper publications.
Announcement under Regulation 30 (LODR)-Analyst / Investor Meet - Outcome
12-Jun-2026 | Source : BSEEnclosed is the outcome of the Investor Conference Call held on June 12 2026
Corporate Actions

No Upcoming Board Meetings

RACL Geartech Ltd has declared 15% dividend, ex-date: 20 Feb 26

No Splits history available

No Bonus history available

No Rights history available
Quality key factors
Valuation key factors
Technicals key factors
 Technical Indicator Scale: Bearish, Mildly Bearish, Sideways, Mildly Bullish, Bullish Turned
 Shareholding Snapshot : Mar 2026
Shareholding Compare (%holding)
Non Institution
None
Held by 1 Schemes (0.62%)
Held by 10 FIIs (9.54%)
Gursharan Singh (33.47%)
Malabar India Fund Limited (5.87%)
33.74%
Quarterly Results Snapshot (Consolidated) - Mar'26 - QoQ

QoQ Growth in quarter ended Mar 2026 is -4.12% vs 14.14% in Dec 2025
QoQ Growth in quarter ended Mar 2026 is -24.19% vs 35.19% in Dec 2025
Half Yearly Results Snapshot (Consolidated) - Sep'25
Growth in half year ended Sep 2025 is 2.78% vs 13.15% in Sep 2024

Growth in half year ended Sep 2025 is 89.99% vs -43.65% in Sep 2024
Nine Monthly Results Snapshot (Consolidated) - Dec'25
YoY Growth in nine months ended Dec 2025 is 9.31% vs 8.06% in Dec 2024
YoY Growth in nine months ended Dec 2025 is 112.42% vs -44.40% in Dec 2024
Annual Results Snapshot (Consolidated) - Mar'26
YoY Growth in year ended Mar 2026 is 18.04% vs 1.36% in Mar 2025
YoY Growth in year ended Mar 2026 is 106.19% vs -39.75% in Mar 2025
About RACL Geartech Ltd

Company Coordinates


