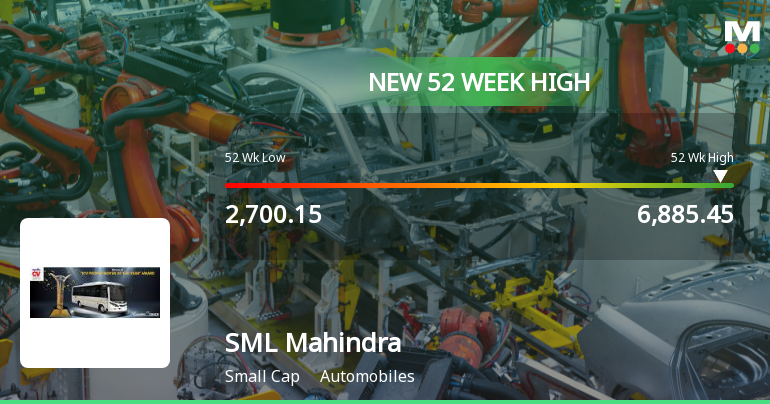
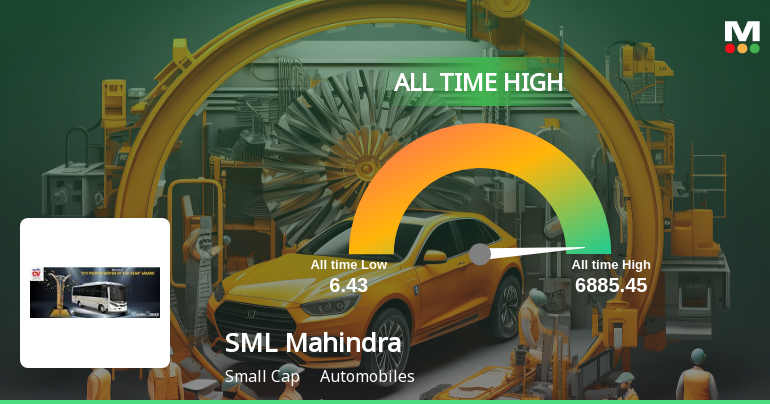
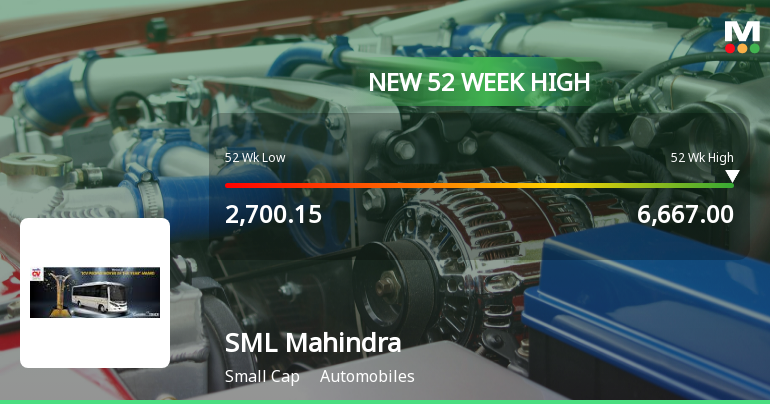
SML Mahindra

  • Market Cap: Small Cap
  • Industry: Automobiles
  • ISIN: INE294B01019
  • NSEID: SMLMAH
  • BSEID: 505192
INR
5,554.25
-131.75 (-2.32%)
BSENSE

Aug 07, 03:30 PM

BSE+NSE Vol: 1.0 lacs

  • Price Points
  • Score
  • Mojo Parameters
  • Total Return
  • News and Corporate Actions
  • Key factors
  • Shareholding
  • Financials
  • CompanyCV
stock-summaryPrice Point
High/Low

1Day

52 Week

Valuation
Technical
Day's Volume

CASH

1.0 lacs (-59.49%) Volume

Shareholding (Jun 2026)

FII

1.24%

Held by 34 FIIs

DII

2.43%

Held by 1 DIIs

Promoter

58.97%

Why is SML Mahindra Ltd falling/rising?

08-Aug-2026

As of 07-Aug, SML Mahindra Ltd's stock price is at 5,554.25, down 2.32% and has declined for two consecutive days. Despite strong long-term growth indicators, recent performance and reduced investor participation are negatively impacting market sentiment.

As of 07-Aug, SML Mahindra Ltd's stock price is falling, currently at 5,554.25, which reflects a decrease of 131.75 or 2.32%. The stock has underperformed its sector by 2.17% today and has been on a consecutive decline for the last two days, resulting in a total drop of 6.11% during this period. Additionally, the stock reached an intraday low of Rs 5524.65, marking a decrease of 2.84%.<BR><BR>Investor participation has also been declining, as evidenced by a significant drop in delivery volume, which fell by 67.7% compared to the 5-day average. Although the stock remains above its 20-day, 50-day, 100-day, and 200-day moving averages, it is lower than its 5-day moving average, indicating short-term weakness.<BR><BR>Despite these negative trends, the company has shown healthy long-term growth, with net sales increasing at an annual rate of 34.80% and operating profit at 33.92%. Furthermore, institutional investors have increased their stake by 1.34% over the previous quarter, suggesting some level of confidence in the company's fundamentals. However, the current market sentiment appears to be influenced more by recent performance and declining participation than by these positive long-term indicators.

View full answer

Are SML Mahindra Ltd latest results good or bad?

21-Jul-2026

SML Mahindra Ltd's latest results show strong revenue growth of 13.20% year-on-year to ₹957.54 crores, but a decline in net profit by 4.99% to ₹63.62 crores and a contraction in operating profit margin raise concerns about profitability sustainability.

SML Mahindra Ltd's latest results present a mixed picture. On one hand, the company achieved a notable revenue growth of 13.20% year-on-year, reaching ₹957.54 crores, which reflects strong top-line performance. This growth is encouraging, especially as it marks the highest quarterly revenue for the company.<BR><BR>However, the profitability metrics reveal a concerning trend. The net profit for the quarter declined by 4.99% year-on-year to ₹63.62 crores, indicating that despite the revenue growth, the company is facing challenges in maintaining its profit margins. The operating profit margin also contracted to 10.45%, down from 12.41% in the same quarter last year, highlighting pressures from rising costs, particularly in employee expenses.<BR><BR>Overall, while SML Mahindra has demonstrated solid revenue growth, the decline in net profit and margin compression raises concerns about the sustainability of its profitability. Investors may need to monitor these trends closely as they could impact the company's future performance.

View full answer

Should I buy, sell or hold SML Mahindra Ltd?

21-Jul-2026

How big is SML Mahindra?

11-Jun-2026

As of 10th June, SML Mahindra Ltd has a market capitalization of 5,539.00 Cr, with recent net sales of 2,837.92 Cr and a net profit of 159.75 Cr.

As of 10th June, SML Mahindra Ltd has a market capitalization of 5,539.00 Cr, categorizing it as a Small Cap company.<BR><BR>In the latest 4 quarters, SML Mahindra reported Net Sales of 2,837.92 Cr and a Net Profit of 159.75 Cr.<BR><BR>The latest annual period for the balance sheet is March 2025, with Shareholder's Funds amounting to 382.66 Cr and Total Assets of 1,299.41 Cr.

View full answer

Who are in the management team of SML Mahindra?

11-Jun-2026

The management team of SML Mahindra includes Chairman S K Tuteja, Managing Director & CEO Junya Yamanishi, and several independent and non-executive directors. They are responsible for guiding the company's strategic direction and ensuring regulatory compliance.

The management team of SML Mahindra includes the following key individuals:<BR><BR>1. **S K Tuteja** - Chairman & Independent Director<BR>2. **Sudhir Nayar** - Independent Non-Executive Director<BR>3. **C S Verma** - Independent Non-Executive Director<BR>4. **Atima Khanna** - Independent Non-Executive Director<BR>5. **Masaki Morohoshi** - Non-Executive Director<BR>6. **Takuro Horikoshi** - Non-Executive Director<BR>7. **Takashi Nishida** - Non-Executive Director<BR>8. **Junya Yamanishi** - Managing Director & CEO<BR>9. **Parvesh Madan** - Company Secretary & Compliance Officer<BR><BR>This team plays a crucial role in guiding the company's strategic direction and ensuring compliance with regulatory requirements.

View full answer

Who are the peers of the SML Mahindra?

11-Jun-2026

SML Mahindra's peers include Ola Electric, BEML Ltd, Olectra Greentec, Action Const.Eq., Ajax Engineering, VST Till. Tract., Sanghvi Movers, Landmark Cars, TIL, and Atul Auto. SML Mahindra has the highest 1-year return at 97.42%, while its growth and capital structure are average compared to its peers.

Peers: The peers of SML Mahindra are Ola Electric, BEML Ltd, Olectra Greentec, Action Const.Eq., Ajax Engineering, VST Till. Tract., Sanghvi Movers, Landmark Cars, TIL, and Atul Auto.<BR><BR>Quality Snapshot: Excellent management risk is observed at Ajax Engineering, while Average management risk is found at BEML Ltd, Olectra Greentec, Action Const.Eq., Sanghvi Movers, Landmark Cars, TIL, and the rest. Below Average management risk is noted at Ola Electric and Atul Auto. Growth is Excellent for Olectra Greentec, Action Const.Eq., and Sanghvi Movers, while Average growth is seen at BEML Ltd, Ajax Engineering, SML Mahindra, and the rest. Below Average growth is present at Ola Electric, VST Till. Tract., Landmark Cars, TIL, and Atul Auto. Capital Structure is Good for BEML Ltd, Olectra Greentec, Action Const.Eq., Ajax Engineering, and Sanghvi Movers, while Average capital structure is noted for SML Mahindra, and Below Average for Ola Electric, Landmark Cars, TIL, and Atul Auto.<BR><BR>Return Snapshot: SML Mahindra has the highest 1-year return at 97.42%, while Action Const.Eq. has the lowest at -30.45%. Compared to its peers, SML Mahindra's return is significantly higher. Additionally, VST Till. Tract., TIL, and Landmark Cars have negative six-month returns.

View full answer

What does SML Mahindra do?

10-Jun-2026

SML Mahindra Ltd, a small-cap company in the automobile industry, was incorporated in 1983 and reported net sales of ₹898 Cr and a net profit of ₹54 Cr for March 2026. The company has a market cap of ₹5,539 Cr and key financial metrics include a P/E ratio of 34.00 and a return on equity of 30.76%.

Overview: <BR>SML Mahindra Ltd operates in the automobiles industry and is categorized as a small-cap company.<BR><BR>History: <BR>Incorporated in July 1983, the company was originally known as Swaraj Vehicles Limited and later changed its name to SML Isuzu Limited on January 3, 2011. The latest quarterly results reported net sales and net profit for March 2026.<BR><BR>Financial Snapshot: <BR>Most recent Net Sales: 898 Cr (Quarterly Results - Mar 2026) <BR>Most recent Net Profit: 54 Cr (Quarterly Results - Mar 2026) <BR>Market-cap value: INR 5,539 Cr (Small Cap)<BR><BR>Key Metrics: <BR>P/E: 34.00 <BR>Industry P/E: 23 <BR>Dividend Yield: 0.48% <BR>Debt Equity: 0.52 <BR>Return on Equity: 30.76% <BR>Price to Book: 10.51<BR><BR>Contact Details: <BR>Address: Village Asron, Shahid Bhagat Singh Nagar(DT) Nawanshahar Punjab : 144533 <BR>Tel: 91-1881-270255 <BR>Email: investors@smlisuzu.com <BR>Website: http://www.smlisuzu.com

View full answer

Is SML Mahindra technically bullish or bearish?

04-Dec-2025

As of December 3, 2025, the trend has shifted to bullish, supported by strong daily moving averages and Bollinger Bands, despite some mildly bearish weekly MACD and KST signals, with a notable year-to-date return of 150.68%.

As of 3 December 2025, the technical trend has changed from mildly bullish to bullish. The current stance is bullish with strong indicators supporting this view. The daily moving averages are bullish, and both the weekly and monthly Bollinger Bands are bullish as well. Although the MACD and KST show mildly bearish signals on the weekly timeframe, the monthly indicators remain bullish. Dow Theory indicates a mildly bullish stance on both weekly and monthly timeframes. Overall, the strength of the bullish trend is reinforced by the significant returns over various periods, particularly the year-to-date return of 150.68%.

View full answer

How has been the historical performance of SML ISUZU?

28-Oct-2025

SML ISUZU has shown significant growth in net sales and profitability, with net sales increasing from 591.48 Cr in Mar'21 to 2,398.99 Cr in Mar'25, and a turnaround from losses to profits in operating profit, profit before tax, and profit after tax during the same period. Total assets have also expanded, although total debt has risen as well.

Answer:<BR>The historical performance of SML ISUZU shows a significant upward trend in net sales and profitability over the past few years.<BR><BR>Breakdown:<BR>SML ISUZU's net sales have increased from 591.48 Cr in Mar'21 to 2,398.99 Cr in Mar'25, reflecting a strong growth trajectory. Total operating income has similarly risen, reaching 2,398.99 Cr in Mar'25, up from 924.17 Cr in Mar'22. The company's total expenditure, excluding depreciation, has also grown, but at a slower pace, from 659.83 Cr in Mar'21 to 2,164.44 Cr in Mar'25. This has allowed the operating profit (PBDIT) to improve significantly, moving from a loss of 68.35 Cr in Mar'21 to a profit of 240.61 Cr in Mar'25. Profit before tax has followed suit, increasing from a loss of 133.37 Cr in Mar'21 to a profit of 162.38 Cr in Mar'25, while profit after tax has surged from a loss of 133.49 Cr in Mar'21 to a profit of 121.67 Cr in Mar'25. The company's total assets have grown from 843.45 Cr in Mar'20 to 1,299.41 Cr in Mar'25, indicating a solid expansion in its balance sheet. However, total debt has also increased, reaching 321.78 Cr in Mar'25, up from 174.67 Cr in Mar'20. Cash flow from operating activities has shown improvement, with a positive cash flow of 177 Cr in Mar'25 compared to a negative cash flow in previous years. Overall, SML ISUZU has demonstrated a robust recovery and growth in its financial performance over the years.

View full answer

Is SML ISUZU overvalued or undervalued?

21-Oct-2025

As of October 20, 2025, SML ISUZU is considered undervalued with a PE ratio of 28.95 and an attractive valuation grade, despite recent underperformance, indicating potential for future growth.

As of 20 October 2025, SML ISUZU's valuation grade has moved from expensive to attractive, indicating a shift in its market perception. The company is currently considered undervalued based on its financial metrics. Key ratios include a PE ratio of 28.95, an EV to EBITDA of 22.93, and a Price to Book Value of 0.92, which suggests that the stock is trading below its intrinsic value relative to its peers.<BR><BR>In comparison to its industry peers, SML ISUZU's PE ratio is higher than Ashok Leyland's 24.86 but lower than Force Motors' 37.95, while its EV to EBITDA ratio is more favorable than both Ashok Leyland and Force Motors. The PEG ratio of 1.95 indicates that the stock is reasonably priced considering its growth prospects. Despite recent underperformance against the Sensex over the past month, with a decline of 24.20% compared to the Sensex's 2.10% gain, the long-term returns of 660.47% over five years highlight the potential for recovery and growth in the future.

View full answer

Who are the top shareholders of the SML ISUZU?

17-Jul-2025

The top shareholders of SML ISUZU are Sumitomo Corporation with 43.96%, Isuzu Motors Limited with 15%, Foreign Institutional Investors holding 15.24%, and individual investors with a combined 36.23%. There are no pledged promoter holdings or mutual funds invested in the company.

The top shareholders of SML ISUZU include the following:<BR><BR>1. **Sumitomo Corporation** - the promoter with the highest holding, owning 43.96% of the shares.<BR>2. **Isuzu Motors Limited** - the highest public shareholder, holding 15% of the shares.<BR>3. **Foreign Institutional Investors (FIIs)** - collectively holding 15.24% through 19 different FIIs.<BR>4. **Individual Investors** - who hold a combined total of 36.23% of the shares.<BR><BR>There are no pledged promoter holdings, and currently, there are no mutual funds holding shares in the company.

View full answer

When is the next results date for SML ISUZU?

06-Jun-2025

No Upcoming Board Meetings

Has SML ISUZU declared dividend?

06-Jun-2025

SML ISUZU Ltd has declared a 160% dividend, amounting to ₹16 per share, with an ex-date of September 6, 2024. While recent total returns have varied, the company has shown strong long-term price growth, particularly over the past five years.

SML ISUZU Ltd has declared a 160% dividend.<BR><BR>Dividend Details:<BR>- Percentage announced: 160%<BR>- Amount per share: 16 per share<BR>- Ex-date: 06 Sep 2024<BR><BR>Dividend Yield: 0.84%.<BR><BR>Total Returns by Period:<BR>In the last 6 months, the price return was 20.23%, with no dividend return, resulting in a total return of 20.23%.<BR><BR>Over the past year, the price return was -5.86%, with a dividend return of 0.75%, leading to a total return of -5.11%.<BR><BR>In the 2-year period, the price return was 75.56%, with a dividend return of 1.42%, resulting in a total return of 76.98%.<BR><BR>For the 3-year period, the price return was 220.88%, with a dividend return of 3.13%, culminating in a total return of 224.01%.<BR><BR>In the 4-year period, the price return was 317.03%, with a dividend return of 3.42%, leading to a total return of 320.45%.<BR><BR>Over the last 5 years, the price return was 357.53%, with a dividend return of 4.22%, resulting in a total return of 361.75%.<BR><BR>Overall, SML ISUZU Ltd has declared a significant dividend, and while the recent total returns show variability, the long-term performance indicates strong growth, particularly in price returns over the years.

View full answer
iScoreScore
Click here to find our call on this stock
Strong Sell
Sell
Hold
Buy
Strong Buy

Dashboard

1

Healthy long term growth as Net Sales has grown by an annual rate of 34.80% and Operating profit at 33.92%

 
2

Flat results in Jun 26

3

With ROCE of 28.7, it has a Expensive valuation with a 10.5 Enterprise value to Capital Employed

4

Increasing Participation by Institutional Investors

5

Consistent Returns over the last 3 years

stock-summaryMojo Parameters

Mojo Parameters

Loading Valuation Snapshot...

Stock DNA

stock-summary
Industry

Automobiles

stock-summary
Market cap

INR 8,184 Cr (Small Cap)

stock-summary
P/E

51.00

stock-summary
Industry P/E

29

stock-summary
Dividend Yield

0.41%

stock-summary
Debt Equity

0.52

stock-summary
Return on Equity

30.12%

stock-summary
Price to Book

15.84

Revenue and Profits:
Net Sales:
958 Cr
(Quarterly Results - Jun 2026)
Net Profit:
64 Cr
stock-summaryTotal Returns
Total Returns (Price + Dividend) stock-summary
Dividend Yield (0.41%)
TimePeriod
Price Return
Dividend Return
Total Return
3 Months
42.87%
0.63%
43.5%
6 Months
49.23%
0.60%
49.83%
1 Year
51.49%
0.57%
52.06%
2 Years
167.01%
2.92%
169.93%
3 Years
361.78%
4.20%
365.98%
4 Years
710.66%
7.86%
718.52%
5 Years
827.41%
10.13%
837.54%

Latest dividend: 23.5 per share ex-dividend date: Jul-03-2026

Risk Adjusted Returns v/s stock-summary
Returns Beta
Icon
Beta has not been calculated since enough price history is not available
stock-summaryNews & Corporate Actions

News

SML Mahindra Ltd Falls 2.18% Despite 10% Surge: Key Factors Behind the Volatility

Announcements stock-summary

Announcement under Regulation 30 (LODR)-Monthly Business Updates

01-Aug-2026 | Source : BSE

Sales Fig for the month of July 2026

Disclosure Under Regulation 30(2) Of The SEBI LODR Regulations 2015

31-Jul-2026 | Source : BSE

Disclosure under Regulation 30(2) of the Securities and Exchange Board of India (Listing Obligations and Disclosure Requirements) Regulations 2015 read with Clause 20 of Para A of Part A of Schedule III

Board Meeting Outcome for Acquisition Of Mahindra & MahindraS Truck And Bus Division By The Company On A Slump Sale Basis Under Business Transfer Agreement

29-Jul-2026 | Source : BSE

Acquisition of Mahindra & Mahindras Truck and Bus Division by the Company on a Slump Sale basis under Business Transfer Agreement

Corporate Actions stock-summary

stock-summary
BOARD MEETING

No Upcoming Board Meetings

stock-summary
DIVIDEND

SML Mahindra Ltd has declared 235% dividend, ex-date: 03 Jul 26

stock-summary
SPLITS

No Splits history available

stock-summary
BONUS

No Bonus history available

stock-summary
RIGHTS

SML Mahindra Ltd has announced 19:50 rights issue, ex-date: 09 Feb 10

stock-summaryKey Factors

Quality key factors stock-summary

Factor
Value
Sales Growth (5y)
34.80%
EBIT Growth (5y)
33.92%
EBIT to Interest (avg)
5.00
Debt to EBITDA (avg)
1.51
Net Debt to Equity (avg)
0.52
Sales to Capital Employed (avg)
3.27
Tax Ratio
25.41%
Dividend Payout Ratio
21.30%
Pledged Shares
0
Institutional Holding
3.67%
ROCE (avg)
12.29%
ROE (avg)
22.29%

Valuation key factors

Factor
Value
P/E Ratio
51
Industry P/E
29
Price to Book Value
15.45
EV to EBIT
37.59
EV to EBITDA
30.32
EV to Capital Employed
10.53
EV to Sales
2.81
PEG Ratio
5.15
Dividend Yield
0.42%
ROCE (Latest)
28.74%
ROE (Latest)
30.12%

Technicals key factors

Indicator
Weekly
Monthly
MACD
Bullish
Bullish
RSI
Bearish
No Signal
Bollinger Bands
Mildly Bullish
Mildly Bullish
Moving Averages
Bullish (Daily)
KST
Bullish
Bullish
Dow Theory
No Trend
No Trend
OBV
Bullish
Bullish
stock-summary Technical Indicator Scale: Bearish, Mildly Bearish, Sideways, Mildly Bullish, Bullish  Turned 
stock-summaryShareholding
Shareholding Snapshot : Jun 2026stock-summary
Shareholding Compare (%holding) stock-summary
Majority shareholders

Promoters

Pledged Promoter Holdings

None

Mutual Funds

Held by 7 Schemes (0.79%)

FIIs

Held by 34 FIIs (1.24%)

Promoter with highest holding

Mahindra & Mahindra Limited (58.97%)

Highest Public shareholder

Sachin Bansal (partner Of Spv Enterprises) (4.13%)

Individual Investors Holdings

31.74%

stock-summaryFinancial
[
  {
    "link": "quarterly",
    "btn_text": "All Quarterly Results",
    "header": "Quarterly Results Snapshot (Standalone) - Jun'26 - YoY",
    "rhs": [
      {
        "prefix": "Net Sales ",
        "suffix": "YoY Growth in quarter ended Jun 2026 is 13.20% vs 13.39% in Jun 2025",
        "dir": -1
      },
      {
        "prefix": "Standalone Net Profit ",
        "suffix": "YoY Growth in quarter ended Jun 2026 is -4.99% vs 44.34% in Jun 2025",
        "dir": -1
      }
    ],
    "table": {
      "header": [
        "Jun'26",
        "Jun'25",
        "Change(%)"
      ],
      "body": [
        {
          "field": "Net Sales",
          "val1": "957.54",
          "val2": "845.89",
          "chgp": "13.20%",
          "chgp_class": "positive"
        },
        {
          "field": "Operating Profit (PBDIT) excl Other Income",
          "val1": "100.10",
          "val2": "105.01",
          "chgp": "-4.68%",
          "chgp_class": "negative"
        },
        {
          "field": "Interest",
          "val1": "2.74",
          "val2": "5.09",
          "chgp": "-46.17%",
          "chgp_class": "positive"
        },
        {
          "field": "Exceptional Items",
          "val1": "0.00",
          "val2": "0.00",
          "chgp": "",
          "chgp_class": "neutral"
        },
        {
          "field": "Standalone Net Profit",
          "val1": "63.62",
          "val2": "66.96",
          "chgp": "-4.99%",
          "chgp_class": "negative"
        },
        {
          "field": "Operating Profit Margin (Excl OI)",
          "val1": "10.45%",
          "val2": "12.41%",
          "chgp": "-1.96%",
          "chgp_class": "negative"
        }
      ]
    }
  },
  {
    "link": "half-yearly",
    "btn_text": "All Half Yearly Results",
    "header": "Half Yearly Results Snapshot (Standalone) - Sep'25",
    "rhs": [
      {
        "prefix": "Net Sales ",
        "suffix": " Growth in half year ended Sep 2025 is 8.12% vs 14.65% in Sep 2024",
        "dir": -1
      },
      {
        "prefix": "Standalone Net Profit ",
        "suffix": " Growth in half year ended Sep 2025 is 29.07% vs 28.95% in Sep 2024",
        "dir": 1
      }
    ],
    "table": {
      "header": [
        "Sep'25",
        "Sep'24",
        "Change(%)"
      ],
      "body": [
        {
          "field": "Net Sales",
          "val1": "1,401.00",
          "val2": "1,295.81",
          "chgp": "8.12%",
          "chgp_class": "positive"
        },
        {
          "field": "Operating Profit (PBDIT) excl Other Income",
          "val1": "146.93",
          "val2": "125.78",
          "chgp": "16.82%",
          "chgp_class": "positive"
        },
        {
          "field": "Interest",
          "val1": "7.96",
          "val2": "13.85",
          "chgp": "-42.53%",
          "chgp_class": "positive"
        },
        {
          "field": "Exceptional Items",
          "val1": "0.00",
          "val2": "0.00",
          "chgp": "",
          "chgp_class": "neutral"
        },
        {
          "field": "Standalone Net Profit",
          "val1": "88.01",
          "val2": "68.19",
          "chgp": "29.07%",
          "chgp_class": "positive"
        },
        {
          "field": "Operating Profit Margin (Excl OI)",
          "val1": "10.49%",
          "val2": "9.71%",
          "chgp": "0.78%",
          "chgp_class": "positive"
        }
      ]
    }
  },
  {
    "link": "nine-monthly",
    "btn_text": "All Nine Monthly Results",
    "header": "Nine Monthly Results Snapshot (Standalone) - Dec'25",
    "rhs": [
      {
        "prefix": "Net Sales ",
        "suffix": "YoY Growth in nine months ended Dec 2025 is 19.21% vs 7.34% in Dec 2024",
        "dir": 1
      },
      {
        "prefix": "Standalone Net Profit ",
        "suffix": "YoY Growth in nine months ended Dec 2025 is 53.59% vs 23.69% in Dec 2024",
        "dir": 1
      }
    ],
    "table": {
      "header": [
        "Dec'25",
        "Dec'24",
        "Change(%)"
      ],
      "body": [
        {
          "field": "Net Sales",
          "val1": "1,940.27",
          "val2": "1,627.61",
          "chgp": "19.21%",
          "chgp_class": "positive"
        },
        {
          "field": "Operating Profit (PBDIT) excl Other Income",
          "val1": "188.02",
          "val2": "144.11",
          "chgp": "30.47%",
          "chgp_class": "positive"
        },
        {
          "field": "Interest",
          "val1": "13.75",
          "val2": "20.95",
          "chgp": "-34.37%",
          "chgp_class": "positive"
        },
        {
          "field": "Exceptional Items",
          "val1": "0.00",
          "val2": "0.00",
          "chgp": "",
          "chgp_class": "neutral"
        },
        {
          "field": "Standalone Net Profit",
          "val1": "105.55",
          "val2": "68.72",
          "chgp": "53.59%",
          "chgp_class": "positive"
        },
        {
          "field": "Operating Profit Margin (Excl OI)",
          "val1": "9.69%",
          "val2": "8.85%",
          "chgp": "0.84%",
          "chgp_class": "positive"
        }
      ]
    }
  },
  {
    "link": "annual",
    "btn_text": "All Annual Results",
    "header": "Annual Results Snapshot (Standalone) - Mar'26",
    "rhs": [
      {
        "prefix": "Net Sales ",
        "suffix": "YoY Growth in year ended Mar 2026 is 18.30% vs 9.25% in Mar 2025",
        "dir": 1
      },
      {
        "prefix": "Standalone Net Profit ",
        "suffix": "YoY Growth in year ended Mar 2026 is 31.30% vs 12.78% in Mar 2025",
        "dir": 1
      }
    ],
    "table": {
      "header": [
        "Mar'26",
        "Mar'25",
        "Change(%)"
      ],
      "body": [
        {
          "field": "Net Sales",
          "val1": "2,837.92",
          "val2": "2,398.99",
          "chgp": "18.30%",
          "chgp_class": "positive"
        },
        {
          "field": "Operating Profit (PBDIT) excl Other Income",
          "val1": "278.40",
          "val2": "234.55",
          "chgp": "18.70%",
          "chgp_class": "positive"
        },
        {
          "field": "Interest",
          "val1": "20.74",
          "val2": "29.88",
          "chgp": "-30.59%",
          "chgp_class": "positive"
        },
        {
          "field": "Exceptional Items",
          "val1": "0.00",
          "val2": "0.00",
          "chgp": "",
          "chgp_class": "neutral"
        },
        {
          "field": "Standalone Net Profit",
          "val1": "159.75",
          "val2": "121.67",
          "chgp": "31.30%",
          "chgp_class": "positive"
        },
        {
          "field": "Operating Profit Margin (Excl OI)",
          "val1": "9.81%",
          "val2": "9.78%",
          "chgp": "0.03%",
          "chgp_class": "positive"
        }
      ]
    }
  }
]

Quarterly Results Snapshot (Standalone) - Jun'26 - YoYstock-summary

Jun'26
Jun'25
Change(%)
Net Sales
957.54
845.89
13.20%
Operating Profit (PBDIT) excl Other Income
100.10
105.01
-4.68%
Interest
2.74
5.09
-46.17%
Exceptional Items
0.00
0.00
Standalone Net Profit
63.62
66.96
-4.99%
Operating Profit Margin (Excl OI)
10.45%
12.41%
-1.96%
Values in Rs Cr.
Direction Arrows
Net Sales

YoY Growth in quarter ended Jun 2026 is 13.20% vs 13.39% in Jun 2025

Direction Arrows
Standalone Net Profit

YoY Growth in quarter ended Jun 2026 is -4.99% vs 44.34% in Jun 2025

Half Yearly Results Snapshot (Standalone) - Sep'25stock-summary

Sep'25
Sep'24
Change(%)
Net Sales
1,401.00
1,295.81
8.12%
Operating Profit (PBDIT) excl Other Income
146.93
125.78
16.82%
Interest
7.96
13.85
-42.53%
Exceptional Items
0.00
0.00
Standalone Net Profit
88.01
68.19
29.07%
Operating Profit Margin (Excl OI)
10.49%
9.71%
0.78%
Values in Rs Cr.
Direction Arrows
Net Sales

Growth in half year ended Sep 2025 is 8.12% vs 14.65% in Sep 2024

Direction Arrows
Standalone Net Profit

Growth in half year ended Sep 2025 is 29.07% vs 28.95% in Sep 2024

Nine Monthly Results Snapshot (Standalone) - Dec'25stock-summary

Dec'25
Dec'24
Change(%)
Net Sales
1,940.27
1,627.61
19.21%
Operating Profit (PBDIT) excl Other Income
188.02
144.11
30.47%
Interest
13.75
20.95
-34.37%
Exceptional Items
0.00
0.00
Standalone Net Profit
105.55
68.72
53.59%
Operating Profit Margin (Excl OI)
9.69%
8.85%
0.84%
Values in Rs Cr.
Direction Arrows
Net Sales

YoY Growth in nine months ended Dec 2025 is 19.21% vs 7.34% in Dec 2024

Direction Arrows
Standalone Net Profit

YoY Growth in nine months ended Dec 2025 is 53.59% vs 23.69% in Dec 2024

Annual Results Snapshot (Standalone) - Mar'26stock-summary

Mar'26
Mar'25
Change(%)
Net Sales
2,837.92
2,398.99
18.30%
Operating Profit (PBDIT) excl Other Income
278.40
234.55
18.70%
Interest
20.74
29.88
-30.59%
Exceptional Items
0.00
0.00
Standalone Net Profit
159.75
121.67
31.30%
Operating Profit Margin (Excl OI)
9.81%
9.78%
0.03%
Values in Rs Cr.
Direction Arrows
Net Sales

YoY Growth in year ended Mar 2026 is 18.30% vs 9.25% in Mar 2025

Direction Arrows
Standalone Net Profit

YoY Growth in year ended Mar 2026 is 31.30% vs 12.78% in Mar 2025

stock-summaryCompany CV
About SML Mahindra Ltd stock-summary
stock-summary
SML Mahindra Ltd
Small Cap
Automobiles
SML Mahindra Limited was initially incorporated as 'Swaraj Mazda Limited' on July 26, 1983 with the Registrar of Companies. Name of the Company was changed from Swaraj Mazda Limited to SML Isuzu Limited dated January 3, 2011. Further, the name of the Company was changed from SML Isuzu Limited to SML Mahindra Limited dated 8 October 2025, by issuing a new Certificate of Incorporation by the Central Processing Centre. Company was erstwhile promoted by Japan's Sumitomo Corporation and Isuzu Motors.
Company Coordinates stock-summary
Company Details
Village Asron, Shahid Bhagat Singh Nagar(DT) Nawanshahar Punjab : 144533
stock-summary
Tel: 91-1881-270255
stock-summary
investors@smlisuzu.com
Registrar Details
MCS Ltd , F-65, , Okhla Industrial Area, Phase - I, New Delhi