
 Price Point
Compare Ruby Mills with Similar Stocks
ScoreDashboard
Weak Long Term Fundamental Strength with an average Return on Capital Employed (ROCE) of 5.33%
- Poor long term growth as Operating profit has grown by an annual rate 11.91% of over the last 5 years
Flat results in Jun 26
With ROCE of 5.1, it has a Very Expensive valuation with a 2 Enterprise value to Capital Employed
Despite the size of the company, domestic mutual funds hold only 0% of the company
Mojo ParametersStock DNA

Garments & Apparels

INR 1,705 Cr (Micro Cap)

39.00
28

0.50%

0.47

6.43%

2.49
Total ReturnsTotal Returns (Price + Dividend) 
Latest dividend: 2.4994540292640317 per share ex-dividend date: Sep-17-2026
Risk Adjusted Returns v/s
Returns Beta
 News & Corporate Actions
News

Ruby Mills Ltd is Rated Sell
Ruby Mills Ltd is rated Sell by MarketsMOJO, with this rating last updated on 13 August 2026. However, the analysis and financial metrics discussed here reflect the stock’s current position as of 01 October 2026, providing investors with an up-to-date view of the company’s fundamentals, valuation, financial trend, and technical outlook.
Read full news article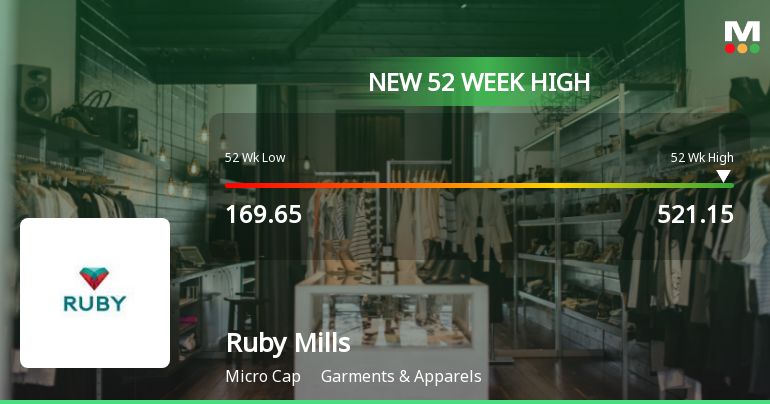
Broad-Based Technical Strength Lifts Ruby Mills Ltd to 52-Week High of Rs 521.15
Surging past Rs 521.15 on 28 Sep 2026, Ruby Mills Ltd has marked a remarkable milestone by hitting a fresh 52-week high, extending its impressive 126.18% gain over the past year despite a broadly declining market backdrop.
Read full news article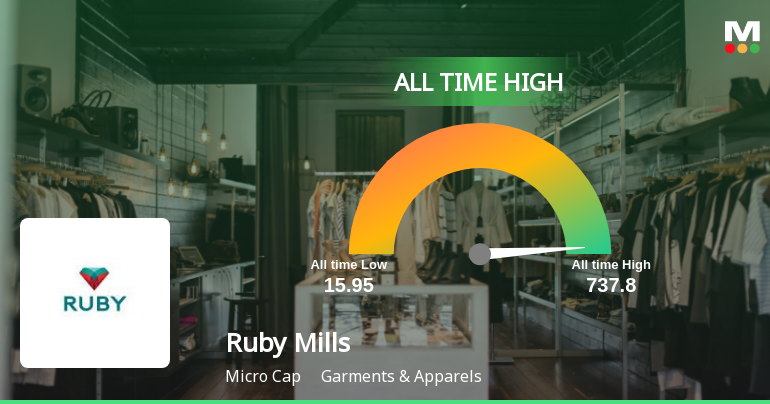
Ruby Mills Ltd Hits All-Time High of Rs 521.15 as Momentum Builds Across Timeframes
Extending its remarkable rally, Ruby Mills Ltd surged to a fresh all-time high of Rs 521.15 on 28 Sep 2026, outperforming the Sensex by nearly 6% on the day and continuing a strong multi-month uptrend.
Read full news article Announcements
Shareholder Meeting / Postal Ballot-Scrutinizers Report
24-Sep-2026 | Source : BSEScrutinizers Report for the 110th Annual General Meeting held on 24.09.2026.
Shareholder Meeting / Postal Ballot-Outcome of AGM
24-Sep-2026 | Source : BSEOutcome of 110th Annual General Meeting held on 24th September 2026.
Closure of Trading Window
24-Sep-2026 | Source : BSEClosure of Trading Window for declaration of Un-audited Financial Results (Standalone and Consolidated ) for the quarter ended 30.09.2026.
Corporate Actions

No Upcoming Board Meetings

Ruby Mills Ltd has declared 50% dividend, ex-date: 17 Sep 26

Ruby Mills Ltd has announced 5:10 stock split, ex-date: 22 Nov 12

Ruby Mills Ltd has announced 1:1 bonus issue, ex-date: 23 Sep 22

No Rights history available
Key FactorsQuality key factors
Valuation key factors
Technicals key factors
 Technical Indicator Scale: Bearish, Mildly Bearish, Sideways, Mildly Bullish, Bullish Turned Shareholding
Shareholding Snapshot : Jun 2026
Shareholding Compare (%holding)
Promoters
None
Held by 0 Schemes
Held by 2 FIIs (0.02%)
Manubhai And Sons Investment Co Pvt Ltd (14.29%)
Adrik Traders Pvt.ltd. (2.92%)
18.01%
FinancialQuarterly Results Snapshot (Standalone) - Jun'26 - QoQ
 Compare with Peers
QoQ Growth in quarter ended Jun 2026 is -25.86% vs 54.22% in Mar 2026
QoQ Growth in quarter ended Jun 2026 is 6.78% vs 17.02% in Mar 2026

Half Yearly Results Snapshot (Standalone) - Sep'25

Growth in half year ended Sep 2025 is 57.18% vs -7.69% in Sep 2024
Growth in half year ended Sep 2025 is 98.71% vs -33.06% in Sep 2024
Nine Monthly Results Snapshot (Standalone) - Dec'25
YoY Growth in nine months ended Dec 2025 is 43.62% vs 0.15% in Dec 2024
YoY Growth in nine months ended Dec 2025 is 23.61% vs -7.46% in Dec 2024
Annual Results Snapshot (Standalone) - Mar'26
YoY Growth in year ended Mar 2026 is 46.16% vs 3.51% in Mar 2025
YoY Growth in year ended Mar 2026 is 3.00% vs -5.01% in Mar 2025
 Company CV
About Ruby Mills Ltd










