
Compare Saraswati Commer with Similar Stocks
Stock DNA
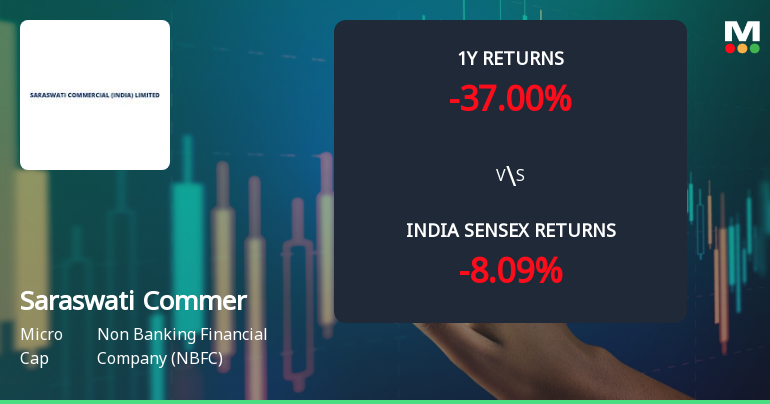
Non Banking Financial Company (NBFC)
INR 1,080 Cr (Micro Cap)
11.00
21
0.00%
0.00
8.38%
0.95
Total Returns (Price + Dividend) 
Saraswati Commer for the last several years.
Risk Adjusted Returns v/s
Returns Beta

News
Saraswati Commercial (India) Ltd: Technical Momentum Shifts Amid Mixed Signals
Saraswati Commercial (India) Ltd, a micro-cap player in the Non Banking Financial Company (NBFC) sector, has exhibited a nuanced shift in its technical momentum, moving from a bearish stance to a mildly bearish trend. Despite a notable 5.56% gain in the latest session, the stock’s technical indicators present a complex picture, with mixed signals from MACD, RSI, moving averages, and other momentum oscillators.
Read full news article
Saraswati Commercial (India) Ltd Technical Momentum Shifts Amid Bearish Sentiment
Saraswati Commercial (India) Ltd, a micro-cap player in the Non Banking Financial Company (NBFC) sector, has experienced a notable shift in its technical momentum, moving from a mildly bearish stance to a more pronounced bearish trend. Despite some mildly bullish weekly signals, the overall technical indicators suggest caution for investors as the stock continues to underperform relative to the broader market benchmarks.
Read full news article
Saraswati Commercial (India) Ltd is Rated Sell
Saraswati Commercial (India) Ltd is rated 'Sell' by MarketsMOJO, with this rating last updated on 13 Feb 2026. However, the analysis and financial metrics discussed here reflect the stock’s current position as of 28 June 2026, providing investors with an up-to-date perspective on the company’s fundamentals, valuation, financial trends, and technical outlook.
Read full news article Announcements
Closure of Trading Window
25-Jun-2026 | Source : BSEIntimation of Closure of Trading Window.
Announcement under Regulation 30 (LODR)-Newspaper Publication
03-Jun-2026 | Source : BSENewspaper Publication regarding Special Window for Transfer & Dematerialization of physical securities of Saraswati Commercial (India) Limited.
Announcement under Regulation 30 (LODR)-Newspaper Publication
28-May-2026 | Source : BSENewspaper Publication of Audited Financial Results of the Company for the quarter and year ended 31st March 2026.
Corporate Actions

No Upcoming Board Meetings

No Dividend history available

No Splits history available

No Bonus history available

No Rights history available
Quality key factors
Valuation key factors
Technicals key factors
 Technical Indicator Scale: Bearish, Mildly Bearish, Sideways, Mildly Bullish, Bullish Turned
 Shareholding Snapshot : Mar 2026
Shareholding Compare (%holding)
Promoters
None
Held by 0 Schemes
Held by 1 FIIs (0.0%)
Winro Commercial (india) Ltd (22.77%)
Ageless Capital And Finance Private Limited (5.83%)
8.31%
Quarterly Results Snapshot (Consolidated) - Mar'26 - QoQ

QoQ Growth in quarter ended Mar 2026 is -150.41% vs -55.39% in Dec 2025
QoQ Growth in quarter ended Mar 2026 is -165.90% vs -58.96% in Dec 2025
Half Yearly Results Snapshot (Consolidated) - Sep'25
Growth in half year ended Sep 2025 is -28.52% vs 152.20% in Sep 2024
Growth in half year ended Sep 2025 is -27.55% vs 140.09% in Sep 2024
Nine Monthly Results Snapshot (Consolidated) - Dec'25

YoY Growth in nine months ended Dec 2025 is 35.15% vs 3.58% in Dec 2024
YoY Growth in nine months ended Dec 2025 is 42.24% vs -6.34% in Dec 2024
Annual Results Snapshot (Consolidated) - Mar'26
YoY Growth in year ended Mar 2026 is 60.32% vs -41.21% in Mar 2025
YoY Growth in year ended Mar 2026 is 72.80% vs -48.59% in Mar 2025
About Saraswati Commercial (India) Ltd

Company Coordinates


