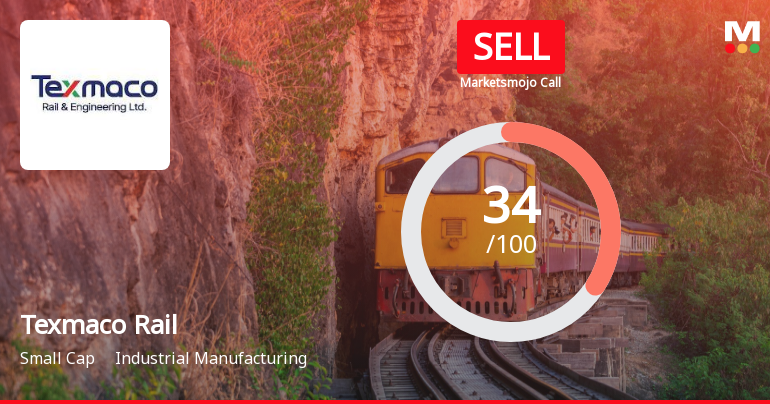
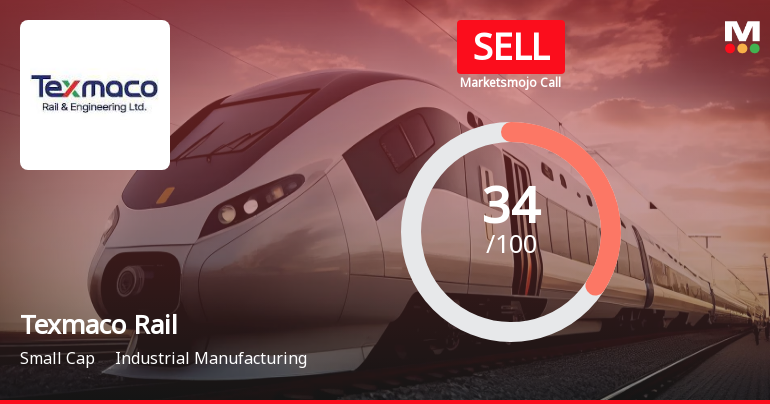
Texmaco Rail

  • Market Cap: Small Cap
  • Industry: Industrial Manufacturing
  • ISIN: INE621L01012
  • NSEID: TEXRAIL
  • BSEID: 533326
INR
108.30
4.15 (3.98%)
BSENSE

Aug 25, 03:30 PM

BSE+NSE Vol: 46.79 lacs

  • Price Points
  • Score
  • Mojo Parameters
  • Total Return
  • News and Corporate Actions
  • Key factors
  • Shareholding
  • Financials
  • CompanyCV
stock-summaryPrice Point
High/Low

1Day

52 Week

Valuation
Technical
Day's Volume

CASH

46.79 lacs (144.83%) Volume

Shareholding (Jun 2026)

FII

5.01%

Held by 60 FIIs

DII

5.13%

Held by 13 DIIs

Promoter

48.34%

Why is Texmaco Rail & Engineering Ltd falling/rising?

25-Aug-2026

As of 24-Aug, Texmaco Rail & Engineering Ltd's stock is at 104.15, down 0.3 (-0.29%), and has underperformed its sector. The stock has declined 24.17% year-to-date and 27.60% over the past year, with reduced investor participation and concerning financial health indicators.

As of 24-Aug, Texmaco Rail & Engineering Ltd's stock price is falling, currently at 104.15, reflecting a decrease of 0.3 (-0.29%). The stock has underperformed its sector by 0.57% today and has experienced a consecutive decline over the last two days, resulting in a total drop of 1.56% during this period. <BR><BR>The stock's performance has been consistently poor, with a year-to-date decline of 24.17% and a one-year drop of 27.60%. This underperformance is further highlighted by the fact that it has fallen significantly compared to the benchmark Sensex, which has only decreased by 9.21% over the same period. Additionally, Texmaco Rail is trading below its moving averages across various time frames, indicating a bearish trend.<BR><BR>Investor participation has also diminished, with delivery volume dropping by 32.08% compared to the five-day average, suggesting a lack of confidence among investors. Institutional investors have reduced their stake by 2.88% in the previous quarter, further indicating declining interest in the stock. <BR><BR>The company's financial health is concerning, as evidenced by a weak EBIT to Interest ratio of 1.95, which reflects its poor ability to service debt. Furthermore, the company reported negative results in its latest quarterly earnings, with a significant drop in profit before tax and net sales. Overall, these factors contribute to the stock's downward trajectory.

View full answer

Should I buy, sell or hold Texmaco Rail & Engineering Ltd?

22-Aug-2026

Who are in the management team of Texmaco Rail?

14-Aug-2026

The management team of Texmaco Rail includes S K Poddar (Executive Chairman), D H Kela (CEO), A K Vijay (CFO), and several non-executive and independent directors, all of whom guide the company's strategic direction and operations.

The management team of Texmaco Rail includes the following key members:<BR><BR>1. **S K Poddar** - Executive Chairman<BR>2. **D H Kela** - Executive Director & CEO<BR>3. **A K Vijay** - Executive Director & CFO<BR>4. **Indajit Mookerjee** - Vice Chairman & Executive Director<BR>5. **Akshay Poddar** - Non-Executive & Non-Independent Director<BR>6. **D R Kaarthikeyan** - Non-Executive & Independent Director<BR>7. **Utsav Parekh** - Non-Executive & Independent Director<BR>8. **Rusha Mitra** - Non-Executive & Independent Director<BR>9. **Virendra Sinha** - Non-Executive & Independent Director<BR>10. **Amitabha Guha** - Independent Director<BR>11. **Partha S Bhattacharyya** - Independent Director<BR><BR>This team plays a crucial role in guiding the company's strategic direction and operations.

View full answer

What does Texmaco Rail do?

14-Aug-2026

Texmaco Rail & Engineering Ltd is a small-cap industrial manufacturing company specializing in rail and engineering products. As of June 2026, it reported net sales of ₹757 Cr and a net profit of ₹50 Cr, with a market cap of ₹4,372 Cr.

Overview:<BR>Texmaco Rail & Engineering Ltd is engaged in industrial manufacturing and operates within the small-cap market segment.<BR><BR>History:<BR>The company was originally incorporated on June 25, 1998, as Texmaco Machines Private Limited. It transitioned to a public limited company on March 3, 2010, changing its name to Texmaco Machines Limited, and subsequently to Texmaco Rail & Engineering Limited on April 23, 2010. The latest reported quarterly results indicate net sales and profit for June 2026.<BR><BR>Financial Snapshot:<BR>Net Sales: 757 Cr (Quarterly Results - Jun 2026)<BR>Net Profit: 50 Cr (Quarterly Results - Jun 2026)<BR>Market Cap: INR 4,372 Cr (Small Cap)<BR><BR>Key Metrics:<BR>P/E: 20.00<BR>Industry P/E: 32<BR>Dividend Yield: 0.68%<BR>Debt-Equity: 0.20<BR>Return on Equity: 8.31%<BR>Price to Book: 1.84<BR><BR>Contact Details:<BR>Address: Belgharia, Kolkata West Bengal: 700056<BR>Tel: 91-33-25691500<BR>Email: texrail_cs@texmaco.in<BR>Website: http://www.texmaco.in

View full answer

Who are the peers of the Texmaco Rail?

14-Aug-2026

Texmaco Rail's peers include DEE Development, John Cockerill, GMM Pfaudler, and others, with varying management and growth risks. Texmaco Rail has a below-average performance, with a 1-year return of -24.02%, significantly lower than John Cockerill's 134.32%.

Peers: The peers of Texmaco Rail are DEE Development, John Cockerill, GMM Pfaudler, Hind Rectifiers, WPIL, Pitti Engg., The Anup Enginee, Windsor Machines, and Aimtron.<BR><BR>Quality Snapshot: Excellent management risk is observed at GMM Pfaudler, Hind Rectifiers, and Pitti Engg., while Good management risk is found at John Cockerill, and The Anup Enginee, and the rest. Average management risk is present at Texmaco Rail, WPIL, and Aimtron, while Below Average management risk is noted at DEE Development and Windsor Machines. For Growth, Excellent growth is seen at DEE Development and Aimtron, while Good growth is found at GMM Pfaudler, Hind Rectifiers, and Pitti Engg., and the rest. Below Average growth is observed at Texmaco Rail, John Cockerill, WPIL, and The Anup Enginee, while Below Average capital structure is noted at DEE Development, Hind Rectifiers, Texmaco Rail, and the rest.<BR><BR>Return Snapshot: The peer with the highest 1-year return is John Cockerill at 134.32%, while Texmaco Rail has the lowest at -24.02%. This indicates that Texmaco Rail's performance is significantly below that of its peers. Additionally, the peers with a negative six-month return include GMM Pfaudler and WPIL.

View full answer

How big is Texmaco Rail?

14-Aug-2026

As of 14th August, Texmaco Rail & Engineering Ltd has a market capitalization of 4,335.00 Cr, with net sales of 4,223.35 Cr and a net profit of 215.19 Cr over the latest four quarters.

As of 14th August, <BR><BR>Market Cap: Texmaco Rail & Engineering Ltd has a market capitalization of 4,335.00 Cr and is classified as a Small Cap company.<BR><BR>Recent Quarterly Performance: The sum of Net Sales for the latest 4 quarters is 4,223.35 Cr, while the sum of Net Profit for the same period is 215.19 Cr.<BR><BR>Balance Sheet Snapshot: The reporting period for the balance sheet is March 2025. Shareholder's Funds stand at 2,797.22 Cr, and Total Assets amount to 4,836.95 Cr.

View full answer

Are Texmaco Rail & Engineering Ltd latest results good or bad?

04-Aug-2026

Texmaco Rail & Engineering Ltd's latest results show a 66.86% increase in net profit to ₹50.04 crore, but this is misleading due to a negative tax charge. Revenue fell sharply by 35.16% quarter-on-quarter, indicating significant operational challenges, making the overall results mixed and caution advised for investors.

Texmaco Rail & Engineering Ltd's latest results present a mixed picture. On one hand, the company reported a consolidated net profit of ₹50.04 crore for Q1 FY27, which is a significant increase of 66.86% year-on-year. However, this growth is somewhat misleading due to a negative tax charge that inflated the profit figures. <BR><BR>On the other hand, the company faced substantial challenges with its revenue. Net sales dropped sharply by 35.16% quarter-on-quarter and 16.90% year-on-year, reaching ₹756.68 crore, marking it as the lowest quarterly sales figure in recent history. This decline reflects ongoing execution challenges and issues with converting its order book into revenue.<BR><BR>The operating margin also contracted to 7.53%, down from 9.12% in the previous quarter, indicating difficulties in managing costs amidst reduced sales. Although the profit after tax margin improved to 6.62%, this was primarily due to the aforementioned tax benefit rather than operational strength.<BR><BR>Overall, while the profit growth looks positive at first glance, the significant drop in sales and the underlying operational challenges suggest that the results are not entirely favorable. Investors should be cautious, as the company's performance indicates ongoing volatility and execution risks.

View full answer

When is the next results date for Texmaco Rail & Engineering Ltd?

08-May-2026

The next results date for Texmaco Rail & Engineering Ltd is 12 May 2026.

The next results date for Texmaco Rail & Engineering Ltd is scheduled for 12 May 2026.

View full answer

Is Texmaco Rail technically bullish or bearish?

03-Dec-2025

As of December 2, 2025, Texmaco Rail's technical trend has shifted to a moderate bearish stance, indicated by bearish signals from MACD, Bollinger Bands, and moving averages, despite a mildly bullish KST signal on the weekly timeframe.

As of 2 December 2025, the technical trend for Texmaco Rail has changed from mildly bearish to bearish. The current stance is bearish with a moderate strength. Key indicators driving this include bearish signals from both the MACD and Bollinger Bands on weekly and monthly time frames, along with a bearish daily moving average. The KST shows a mildly bullish signal on the weekly but remains bearish monthly, indicating some short-term divergence. Dow Theory also reflects a mildly bearish stance on both weekly and monthly levels. Overall, the combination of these indicators suggests a prevailing bearish sentiment in the market for Texmaco Rail.

View full answer

Is Texmaco Rail overvalued or undervalued?

13-Nov-2025

As of November 12, 2025, Texmaco Rail is considered very attractive and undervalued, with a PE Ratio of 25.83, an EV to EBITDA of 14.42, and a ROCE of 11.00%, making it a more favorable investment compared to peers like Rites and Titagarh Rail, despite a year-to-date stock performance lagging behind the Sensex.

As of 12 November 2025, the valuation grade for Texmaco Rail has moved from attractive to very attractive, indicating a significant improvement in its perceived value. The company is currently considered undervalued. Key ratios include a PE Ratio of 25.83, an EV to EBITDA of 14.42, and a ROCE of 11.00%. <BR><BR>In comparison to its peers, Texmaco Rail's PE Ratio is lower than Rites, which stands at 29.15, and significantly lower than Titagarh Rail's 48.96. This suggests that Texmaco Rail offers a more favorable valuation relative to its competitors in the industrial manufacturing sector. Despite recent stock performance lagging behind the Sensex, particularly with a year-to-date return of -30.86% compared to the Sensex's 8.10%, the overall valuation metrics indicate that Texmaco Rail presents a compelling investment opportunity.

View full answer

How has been the historical performance of Texmaco Rail?

12-Nov-2025

Texmaco Rail has shown significant growth in net sales and profitability from March 2023 to March 2025, with net sales increasing from 2,243.28 crore to 5,106.57 crore and profit after tax rising from 11.53 crore to 225.51 crore, despite challenges in cash flow management. Total assets and liabilities grew proportionally during this period.

Answer:<BR>The historical performance of Texmaco Rail shows significant growth in net sales and profitability over the years, particularly from March 2023 to March 2025.<BR><BR>Breakdown:<BR>Texmaco Rail's net sales have increased dramatically from 2,243.28 crore in March 2023 to 5,106.57 crore in March 2025, reflecting a strong upward trend. Total operating income followed suit, rising from 2,243.28 crore to 5,106.57 crore in the same period. The company's total expenditure also rose, from 2,097.87 crore in March 2023 to 4,639.31 crore in March 2025, primarily driven by increased raw material costs, which surged from 1,922.07 crore to 4,099.29 crore. Operating profit (PBDIT) saw a substantial increase from 171.78 crore to 524.94 crore, indicating improved operational efficiency. Profit before tax rose significantly from 20.41 crore in March 2023 to 344.61 crore in March 2025, and profit after tax followed this trend, increasing from 11.53 crore to 225.51 crore. The earnings per share (EPS) also improved markedly from 0.81 to 6.24 during this period. On the balance sheet, total assets grew from 3,325.32 crore in March 2023 to 4,836.95 crore in March 2025, while total liabilities increased from 3,325.32 crore to 4,836.95 crore, indicating a proportional growth in both assets and liabilities. Cash flow from operating activities showed a negative trend in March 2025 at -46 crore, contrasting with a positive cash flow of 95 crore in March 2024. Overall, Texmaco Rail's financial performance reflects a robust growth trajectory in sales and profitability, despite some challenges in cash flow management.

View full answer

Who are the top shareholders of the Texmaco Rail?

17-Jul-2025

The top shareholders of Texmaco Rail include Zuari International Limited with 15.96%, mutual funds at 5.86%, foreign institutional investors at 8.14%, and individual investors holding 27.45%. The highest public shareholder is Nippon Life India Trustee Ltd, managing 2.86%.

The top shareholders of Texmaco Rail include several key players. The majority shareholders are the promoters, with Zuari International Limited holding the highest stake at 15.96%. Additionally, mutual funds hold 5.86% of the shares through 8 different schemes, while foreign institutional investors (FIIs) account for 8.14% with 99 FIIs involved. The highest public shareholder is Nippon Life India Trustee Ltd, which manages the Nippon India Small Cap Fund, holding 2.86%. Individual investors collectively hold 27.45% of the shares.

View full answer

Has Texmaco Rail declared dividend?

06-Jun-2025

Texmaco Rail & Engineering Ltd has declared a 50% dividend, amounting to ₹0.5 per share, with an ex-date of September 19, 2024. While recent total returns have shown significant fluctuations, longer-term performance indicates substantial growth.

Texmaco Rail & Engineering Ltd has declared a 50% dividend.<BR><BR>Dividend Details:<BR>- Percentage announced: 50%<BR>- Amount per share: 0.5<BR>- Ex-date: 19 Sep 24<BR><BR>Dividend Yield: 0.29%.<BR><BR>Total Returns by Period:<BR>In the last 6 months, the price return was -23.43%, with a dividend return of 0%, resulting in a total return of -23.43%.<BR><BR>Over the past year, the price return was -5.97%, the dividend return was 0.24%, leading to a total return of -5.73%.<BR><BR>In the 2-year period, the price return was 182.1%, with a dividend return of 0.92%, resulting in a total return of 183.02%.<BR><BR>For the 3-year period, the price return was 270.11%, the dividend return was 1.94%, culminating in a total return of 272.05%.<BR><BR>In the last 4 years, the price return was 423.04%, with a dividend return of 2.33%, resulting in a total return of 425.37%.<BR><BR>Over the 5-year period, the price return was 538.84%, with a dividend return of 3.22%, leading to a total return of 542.06%.<BR><BR>Overall, Texmaco Rail has declared a dividend, but the recent total returns indicate significant fluctuations, particularly negative returns in the short term, while longer-term returns show substantial growth.

View full answer
iScoreScore
Click here to find our call on this stock
Strong Sell
Sell
Hold
Buy
Strong Buy

Dashboard

1

Company's ability to service its debt is weak with a poor EBIT to Interest (avg) ratio of 1.95

  • Poor long term growth as Operating profit has grown by an annual rate 19.91% of over the last 5 years
  • Company's ability to service its debt is weak with a poor EBIT to Interest (avg) ratio of 1.95
  • The company has been able to generate a Return on Equity (avg) of 5.02% signifying low profitability per unit of shareholders funds
2

Poor long term growth as Operating profit has grown by an annual rate 19.91% of over the last 5 years

 
3

Negative results in Jun 26

4

Falling Participation by Institutional Investors

stock-summaryMojo Parameters

Mojo Parameters

Loading Valuation Snapshot...

Stock DNA

stock-summary
Industry

Industrial Manufacturing

stock-summary
Market cap

INR 4,451 Cr (Small Cap)

stock-summary
P/E

20.00

stock-summary
Industry P/E

31

stock-summary
Dividend Yield

0.71%

stock-summary
Debt Equity

0.20

stock-summary
Return on Equity

8.31%

stock-summary
Price to Book

1.78

Revenue and Profits:
Net Sales:
757 Cr
(Quarterly Results - Jun 2026)
Net Profit:
50 Cr
stock-summaryTotal Returns
Total Returns (Price + Dividend) stock-summary
Dividend Yield (0.71%)
TimePeriod
Price Return
Dividend Return
Total Return
3 Months
-4.41%
0%
-4.41%
6 Months
1.79%
0%
1.79%
1 Year
-24.0%
0.54%
-23.46%
2 Years
-56.43%
0.53%
-55.9%
3 Years
-17.36%
0.87%
-16.49%
4 Years
124.92%
2.93%
127.85%
5 Years
265.88%
4.78%
270.66%

Latest dividend: 0.75 per share ex-dividend date: Sep-15-2025

Risk Adjusted Returns v/s stock-summary
Returns Beta
Icon
Beta has not been calculated since enough price history is not available
stock-summaryNews & Corporate Actions

News

Announcements stock-summary

Announcement under Regulation 30 (LODR)-Newspaper Publication

22-Aug-2026 | Source : BSE

Copy of Newspaper Publication

Announcement under Regulation 30 (LODR)-Analyst / Investor Meet - Intimation

21-Aug-2026 | Source : BSE

Investor meet intimation

Announcement under Regulation 30 (LODR)-Analyst / Investor Meet - Intimation

21-Aug-2026 | Source : BSE

Investor meet intimation

Corporate Actions stock-summary

stock-summary
BOARD MEETING

No Upcoming Board Meetings

stock-summary
DIVIDEND

Texmaco Rail & Engineering Ltd has declared 75% dividend, ex-date: 15 Sep 25

stock-summary
SPLITS

No Splits history available

stock-summary
BONUS

No Bonus history available

stock-summary
RIGHTS

Texmaco Rail & Engineering Ltd has announced 2:7 rights issue, ex-date: 21 Oct 21

stock-summaryKey Factors

Quality key factors stock-summary

Factor
Value
Sales Growth (5y)
18.58%
EBIT Growth (5y)
19.91%
EBIT to Interest (avg)
1.95
Debt to EBITDA (avg)
4.15
Net Debt to Equity (avg)
0.20
Sales to Capital Employed (avg)
1.09
Tax Ratio
22.39%
Dividend Payout Ratio
12.02%
Pledged Shares
0
Institutional Holding
10.14%
ROCE (avg)
8.36%
ROE (avg)
5.02%

Valuation key factors

Factor
Value
P/E Ratio
20
Industry P/E
31
Price to Book Value
1.86
EV to EBIT
14.85
EV to EBITDA
12.94
EV to Capital Employed
1.72
EV to Sales
1.15
PEG Ratio
NA
Dividend Yield
0.68%
ROCE (Latest)
12.09%
ROE (Latest)
8.31%

Technicals key factors

Indicator
Weekly
Monthly
MACD
Mildly Bullish
Bearish
RSI
No Signal
No Signal
Bollinger Bands
Mildly Bearish
Bearish
Moving Averages
Bearish (Daily)
KST
Mildly Bearish
Bearish
Dow Theory
Mildly Bearish
Mildly Bullish
OBV
No Trend
No Trend
stock-summary Technical Indicator Scale: Bearish, Mildly Bearish, Sideways, Mildly Bullish, Bullish  Turned 
stock-summaryShareholding
Shareholding Snapshot : Jun 2026stock-summary
Shareholding Compare (%holding) stock-summary
Majority shareholders

Promoters

Pledged Promoter Holdings

None

Mutual Funds

Held by 7 Schemes (4.74%)

FIIs

Held by 60 FIIs (5.01%)

Promoter with highest holding

Zuari International Limited (15.67%)

Highest Public shareholder

Nippon Life India Trustee Ltd-a/c Nippon India Sma (2.8%)

Individual Investors Holdings

33.03%

stock-summaryFinancial
[
  {
    "link": "quarterly",
    "btn_text": "All Quarterly Results",
    "header": "Quarterly Results Snapshot (Consolidated) - Jun'26 - YoY",
    "rhs": [
      {
        "prefix": "Net Sales ",
        "suffix": "YoY Growth in quarter ended Jun 2026 is -16.90% vs -16.32% in Jun 2025",
        "dir": -1
      },
      {
        "prefix": "Consolidated Net Profit ",
        "suffix": "YoY Growth in quarter ended Jun 2026 is 66.86% vs -49.87% in Jun 2025",
        "dir": 1
      }
    ],
    "table": {
      "header": [
        "Jun'26",
        "Jun'25",
        "Change(%)"
      ],
      "body": [
        {
          "field": "Net Sales",
          "val1": "756.68",
          "val2": "910.60",
          "chgp": "-16.90%",
          "chgp_class": "negative"
        },
        {
          "field": "Operating Profit (PBDIT) excl Other Income",
          "val1": "57.00",
          "val2": "70.93",
          "chgp": "-19.64%",
          "chgp_class": "negative"
        },
        {
          "field": "Interest",
          "val1": "25.08",
          "val2": "30.72",
          "chgp": "-18.36%",
          "chgp_class": "positive"
        },
        {
          "field": "Exceptional Items",
          "val1": "0.00",
          "val2": "0.00",
          "chgp": "",
          "chgp_class": "neutral"
        },
        {
          "field": "Consolidate Net Profit",
          "val1": "50.04",
          "val2": "29.99",
          "chgp": "66.86%",
          "chgp_class": "positive"
        },
        {
          "field": "Operating Profit Margin (Excl OI)",
          "val1": "7.53%",
          "val2": "7.79%",
          "chgp": "-0.26%",
          "chgp_class": "negative"
        }
      ]
    }
  },
  {
    "link": "half-yearly",
    "btn_text": "All Half Yearly Results",
    "header": "Half Yearly Results Snapshot (Consolidated) - Sep'25",
    "rhs": [
      {
        "prefix": "Net Sales ",
        "suffix": " Growth in half year ended Sep 2025 is -10.90% vs 66.50% in Sep 2024",
        "dir": -1
      },
      {
        "prefix": "Consolidated Net Profit ",
        "suffix": " Growth in half year ended Sep 2025 is -28.69% vs 254.79% in Sep 2024",
        "dir": -1
      }
    ],
    "table": {
      "header": [
        "Sep'25",
        "Sep'24",
        "Change(%)"
      ],
      "body": [
        {
          "field": "Net Sales",
          "val1": "2,168.70",
          "val2": "2,434.08",
          "chgp": "-10.90%",
          "chgp_class": "negative"
        },
        {
          "field": "Operating Profit (PBDIT) excl Other Income",
          "val1": "195.32",
          "val2": "239.09",
          "chgp": "-18.31%",
          "chgp_class": "negative"
        },
        {
          "field": "Interest",
          "val1": "60.92",
          "val2": "68.13",
          "chgp": "-10.58%",
          "chgp_class": "positive"
        },
        {
          "field": "Exceptional Items",
          "val1": "0.00",
          "val2": "0.00",
          "chgp": "",
          "chgp_class": "neutral"
        },
        {
          "field": "Consolidate Net Profit",
          "val1": "94.62",
          "val2": "132.69",
          "chgp": "-28.69%",
          "chgp_class": "negative"
        },
        {
          "field": "Operating Profit Margin (Excl OI)",
          "val1": "9.01%",
          "val2": "9.82%",
          "chgp": "-0.81%",
          "chgp_class": "negative"
        }
      ]
    }
  },
  {
    "link": "nine-monthly",
    "btn_text": "All Nine Monthly Results",
    "header": "Nine Monthly Results Snapshot (Consolidated) - Dec'25",
    "rhs": [
      {
        "prefix": "Net Sales ",
        "suffix": "YoY Growth in nine months ended Dec 2025 is -14.62% vs 59.45% in Dec 2024",
        "dir": -1
      },
      {
        "prefix": "Consolidated Net Profit ",
        "suffix": "YoY Growth in nine months ended Dec 2025 is -34.36% vs 208.45% in Dec 2024",
        "dir": -1
      }
    ],
    "table": {
      "header": [
        "Dec'25",
        "Dec'24",
        "Change(%)"
      ],
      "body": [
        {
          "field": "Net Sales",
          "val1": "3,210.30",
          "val2": "3,760.22",
          "chgp": "-14.62%",
          "chgp_class": "negative"
        },
        {
          "field": "Operating Profit (PBDIT) excl Other Income",
          "val1": "283.98",
          "val2": "369.65",
          "chgp": "-23.18%",
          "chgp_class": "negative"
        },
        {
          "field": "Interest",
          "val1": "92.41",
          "val2": "102.84",
          "chgp": "-10.14%",
          "chgp_class": "positive"
        },
        {
          "field": "Exceptional Items",
          "val1": "-3.02",
          "val2": "0.00",
          "chgp": "",
          "chgp_class": "neutral"
        },
        {
          "field": "Consolidate Net Profit",
          "val1": "137.46",
          "val2": "209.41",
          "chgp": "-34.36%",
          "chgp_class": "negative"
        },
        {
          "field": "Operating Profit Margin (Excl OI)",
          "val1": "8.85%",
          "val2": "9.83%",
          "chgp": "-0.98%",
          "chgp_class": "negative"
        }
      ]
    }
  },
  {
    "link": "annual",
    "btn_text": "All Annual Results",
    "header": "Annual Results Snapshot (Consolidated) - Mar'26",
    "rhs": [
      {
        "prefix": "Net Sales ",
        "suffix": "YoY Growth in year ended Mar 2026 is -14.28% vs 45.78% in Mar 2025",
        "dir": -1
      },
      {
        "prefix": "Consolidated Net Profit ",
        "suffix": "YoY Growth in year ended Mar 2026 is -21.68% vs 120.10% in Mar 2025",
        "dir": -1
      }
    ],
    "table": {
      "header": [
        "Mar'26",
        "Mar'25",
        "Change(%)"
      ],
      "body": [
        {
          "field": "Net Sales",
          "val1": "4,377.27",
          "val2": "5,106.57",
          "chgp": "-14.28%",
          "chgp_class": "negative"
        },
        {
          "field": "Operating Profit (PBDIT) excl Other Income",
          "val1": "390.42",
          "val2": "467.26",
          "chgp": "-16.44%",
          "chgp_class": "negative"
        },
        {
          "field": "Interest",
          "val1": "122.60",
          "val2": "137.18",
          "chgp": "-10.63%",
          "chgp_class": "positive"
        },
        {
          "field": "Exceptional Items",
          "val1": "-3.13",
          "val2": "0.00",
          "chgp": "",
          "chgp_class": "neutral"
        },
        {
          "field": "Consolidate Net Profit",
          "val1": "195.15",
          "val2": "249.18",
          "chgp": "-21.68%",
          "chgp_class": "negative"
        },
        {
          "field": "Operating Profit Margin (Excl OI)",
          "val1": "8.92%",
          "val2": "9.15%",
          "chgp": "-0.23%",
          "chgp_class": "negative"
        }
      ]
    }
  }
]

Quarterly Results Snapshot (Consolidated) - Jun'26 - YoYstock-summary

Jun'26
Jun'25
Change(%)
Net Sales
756.68
910.60
-16.90%
Operating Profit (PBDIT) excl Other Income
57.00
70.93
-19.64%
Interest
25.08
30.72
-18.36%
Exceptional Items
0.00
0.00
Consolidate Net Profit
50.04
29.99
66.86%
Operating Profit Margin (Excl OI)
7.53%
7.79%
-0.26%
Values in Rs Cr.
Direction Arrows
Net Sales

YoY Growth in quarter ended Jun 2026 is -16.90% vs -16.32% in Jun 2025

Direction Arrows
Consolidated Net Profit

YoY Growth in quarter ended Jun 2026 is 66.86% vs -49.87% in Jun 2025

Half Yearly Results Snapshot (Consolidated) - Sep'25stock-summary

Sep'25
Sep'24
Change(%)
Net Sales
2,168.70
2,434.08
-10.90%
Operating Profit (PBDIT) excl Other Income
195.32
239.09
-18.31%
Interest
60.92
68.13
-10.58%
Exceptional Items
0.00
0.00
Consolidate Net Profit
94.62
132.69
-28.69%
Operating Profit Margin (Excl OI)
9.01%
9.82%
-0.81%
Values in Rs Cr.
Direction Arrows
Net Sales

Growth in half year ended Sep 2025 is -10.90% vs 66.50% in Sep 2024

Direction Arrows
Consolidated Net Profit

Growth in half year ended Sep 2025 is -28.69% vs 254.79% in Sep 2024

Nine Monthly Results Snapshot (Consolidated) - Dec'25stock-summary

Dec'25
Dec'24
Change(%)
Net Sales
3,210.30
3,760.22
-14.62%
Operating Profit (PBDIT) excl Other Income
283.98
369.65
-23.18%
Interest
92.41
102.84
-10.14%
Exceptional Items
-3.02
0.00
Consolidate Net Profit
137.46
209.41
-34.36%
Operating Profit Margin (Excl OI)
8.85%
9.83%
-0.98%
Values in Rs Cr.
Direction Arrows
Net Sales

YoY Growth in nine months ended Dec 2025 is -14.62% vs 59.45% in Dec 2024

Direction Arrows
Consolidated Net Profit

YoY Growth in nine months ended Dec 2025 is -34.36% vs 208.45% in Dec 2024

Annual Results Snapshot (Consolidated) - Mar'26stock-summary

Mar'26
Mar'25
Change(%)
Net Sales
4,377.27
5,106.57
-14.28%
Operating Profit (PBDIT) excl Other Income
390.42
467.26
-16.44%
Interest
122.60
137.18
-10.63%
Exceptional Items
-3.13
0.00
Consolidate Net Profit
195.15
249.18
-21.68%
Operating Profit Margin (Excl OI)
8.92%
9.15%
-0.23%
Values in Rs Cr.
Direction Arrows
Net Sales

YoY Growth in year ended Mar 2026 is -14.28% vs 45.78% in Mar 2025

Direction Arrows
Consolidated Net Profit

YoY Growth in year ended Mar 2026 is -21.68% vs 120.10% in Mar 2025

stock-summaryCompany CV
About Texmaco Rail & Engineering Ltd stock-summary
stock-summary
Texmaco Rail & Engineering Ltd
Small Cap
Industrial Manufacturing
Texmaco Rail & Engineering Limited was originally incorporated on June 25, 1998 as a Private Limited Company with the name 'Texmaco Machines Private Limited'. On March 3, 2010, the Company converted into a Public Limited and the name was changed to Texmaco Machines Limited. On April 23, 2010, name of the Company was changed from Texmaco Machines Limited to Texmaco Rail & Engineering Limited.
Company Coordinates stock-summary
Company Details
Belgharia , Kolkata West Bengal : 700056
stock-summary
Tel: 91-33-25691500
stock-summary
texrail_cs@texmaco.in
Registrar Details
Karvy Computershare Pvt Ltd., Karvy Selenium, Tower-B Plot No 31 & 32, Survey No 116/22, 115/24, 115/25, Financial District, Nanakramguda, Serilingampally, Mandal Ranga Reddy Dist, Hyderabad