
Compare Styrenix Perfor. with Similar Stocks
Dashboard
High Management Efficiency with a high ROE of 16.52%
Company has a Debt to Equity ratio (avg) of 0.09 times
Poor long term growth as Operating profit has grown by an annual rate 0.52% of over the last 5 years
Flat results in Mar 26
With ROCE of 15, it has a Expensive valuation with a 2.9 Enterprise value to Capital Employed
Increasing Participation by Institutional Investors
Underperformed the market in the last 1 year
Stock DNA
Specialty Chemicals
INR 4,208 Cr (Small Cap)
23.00
36
2.20%
0.12
13.85%
3.17
Total Returns (Price + Dividend) 
Latest dividend: 23 per share ex-dividend date: Feb-05-2026
Risk Adjusted Returns v/s
Returns Beta

News
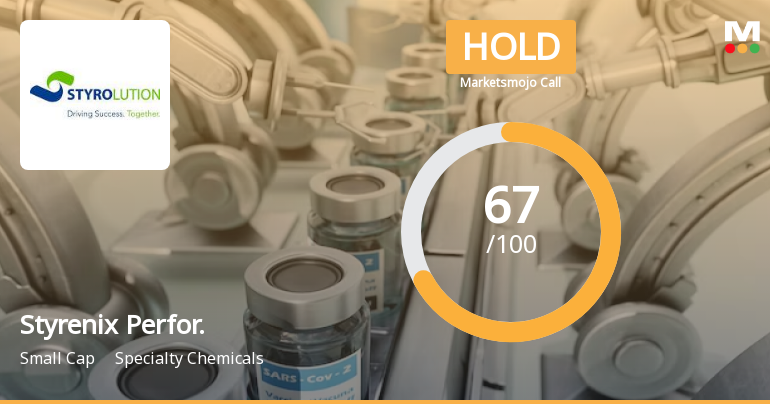
Styrenix Performance Materials Ltd is Rated Hold
Styrenix Performance Materials Ltd is rated 'Hold' by MarketsMOJO, with this rating last updated on 29 June 2026. However, the analysis and financial metrics discussed here reflect the stock's current position as of 22 July 2026, providing investors with the most up-to-date view of the company’s performance and outlook.
Read full news article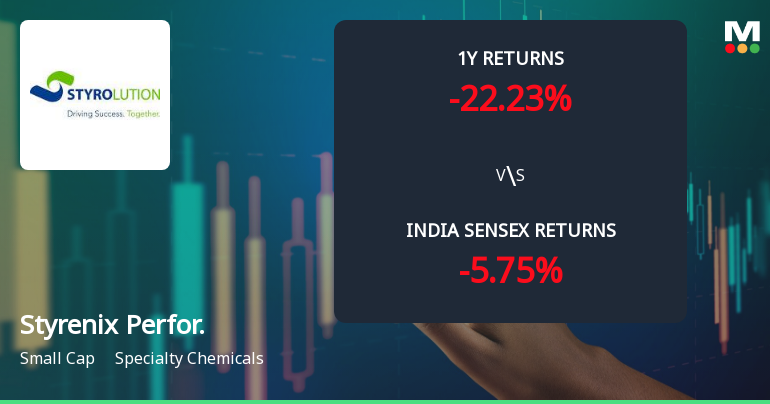
Styrenix Performance Materials Ltd Technical Momentum Shifts to Bullish Amid Strong Returns
Styrenix Performance Materials Ltd, a small-cap player in the specialty chemicals sector, has witnessed a notable shift in its technical momentum, moving from a mildly bullish to a bullish stance. This change is underscored by a mix of positive signals from key technical indicators such as MACD, Bollinger Bands, and moving averages, suggesting renewed investor interest and potential upside in the near term.
Read full news article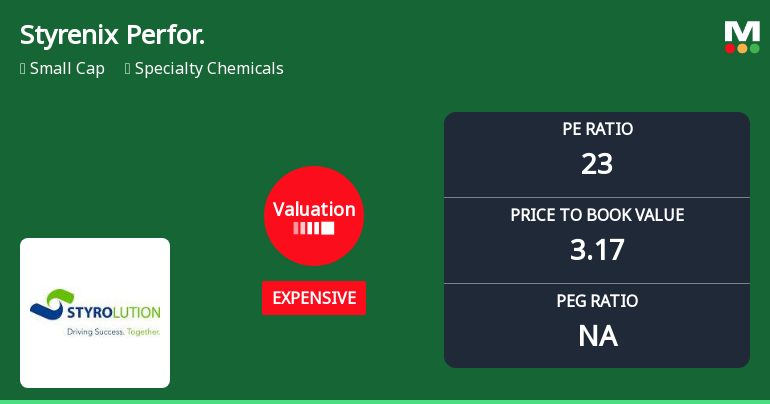
Styrenix Performance Materials Ltd Valuation Shifts Signal Changing Market Sentiment
Styrenix Performance Materials Ltd, a notable player in the Specialty Chemicals sector, has experienced a marked shift in its valuation parameters, prompting a downgrade in its investment grade from Buy to Hold. This change reflects evolving market perceptions as the company’s price-to-earnings (P/E) and price-to-book value (P/BV) ratios move into more expensive territory relative to historical and peer benchmarks.
Read full news article Announcements
Compliances-Certificate under Reg. 74 (5) of SEBI (DP) Regulations 2018
14-Jul-2026 | Source : BSECertificate under Regulation 74(5) of SEBI (DP) Regulations 2018.
Announcement under Regulation 30 (LODR)-Analyst / Investor Meet - Intimation
23-Jun-2026 | Source : BSEIntimation regarding Investor/ analyst Meet.
Announcement under Regulation 30 (LODR)-Analyst / Investor Meet - Intimation
17-Jun-2026 | Source : BSEIntimation regarding Investor/ analyst Meet.
Corporate Actions

No Upcoming Board Meetings

Styrenix Performance Materials Ltd has declared 230% dividend, ex-date: 05 Feb 26

No Splits history available

No Bonus history available

No Rights history available
Quality key factors
Valuation key factors
Technicals key factors
 Technical Indicator Scale: Bearish, Mildly Bearish, Sideways, Mildly Bullish, Bullish Turned
 Shareholding Snapshot : Mar 2026
Shareholding Compare (%holding)
Promoters
None
Held by 7 Schemes (13.82%)
Held by 30 FIIs (0.95%)
Shiva Performance Materials Private Limited (46.24%)
Nippon Life India Trustee Ltd-a/c Nippon India Small Cap Fund (6.31%)
26.33%
Quarterly Results Snapshot (Consolidated) - Mar'26 - QoQ

QoQ Growth in quarter ended Mar 2026 is -4.99% vs 8.83% in Dec 2025

QoQ Growth in quarter ended Mar 2026 is 349.69% vs -63.46% in Dec 2025
Half Yearly Results Snapshot (Consolidated) - Sep'25
Growth in half year ended Sep 2025 is 28.89% vs 18.72% in Sep 2024
Growth in half year ended Sep 2025 is -26.38% vs 47.77% in Sep 2024
Nine Monthly Results Snapshot (Consolidated) - Dec'25
YoY Growth in nine months ended Dec 2025 is 27.87% vs 25.83% in Dec 2024
YoY Growth in nine months ended Dec 2025 is -36.86% vs 44.56% in Dec 2024
Annual Results Snapshot (Consolidated) - Mar'26
YoY Growth in year ended Mar 2026 is 15.28% vs 34.21% in Mar 2025
YoY Growth in year ended Mar 2026 is -21.77% vs 34.97% in Mar 2025
About Styrenix Performance Materials Ltd

Company Coordinates


