
Compare JK Tyre & Indust with Similar Stocks
Dashboard
The company has declared Positive results for the last 3 consecutive quarters
- PAT(Latest six months) At Rs 503.02 cr has Grown at 206.46%
- NET SALES(Q) Highest at Rs 4,223.44 cr
- DEBT-EQUITY RATIO(HY) Lowest at 0.81 times
With ROCE of 14.7, it has a Very Attractive valuation with a 1.5 Enterprise value to Capital Employed
High Institutional Holdings at 26.05%
Market Beating Performance
Stock DNA
Tyres & Rubber Products
INR 12,035 Cr (Small Cap)
13.00
20
0.72%
0.75
14.71%
1.88
Total Returns (Price + Dividend) 
Latest dividend: 3 per share ex-dividend date: Jul-31-2025
Risk Adjusted Returns v/s
Returns Beta

News

JK Tyre & Industries Ltd Upgraded to Hold on Improved Valuation and Financial Trends
JK Tyre & Industries Ltd has seen its investment rating upgraded from Sell to Hold, reflecting significant improvements in valuation metrics, financial trends, and technical indicators. The company’s enhanced performance across key parameters has prompted analysts to revise their outlook, signalling a more favourable stance for investors amid a challenging market environment.
Read full news article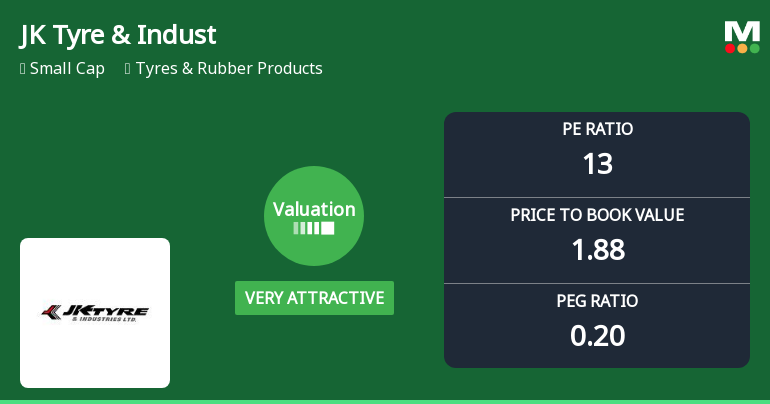
JK Tyre & Industries Ltd Valuation Shifts to Very Attractive Amid Market Volatility
JK Tyre & Industries Ltd has witnessed a notable shift in its valuation parameters, moving from an attractive to a very attractive grade, signalling a potential buying opportunity for investors amid a challenging market backdrop. This upgrade comes alongside a modest day gain and a significant outperformance over the Sensex in the medium to long term, despite recent headwinds.
Read full news article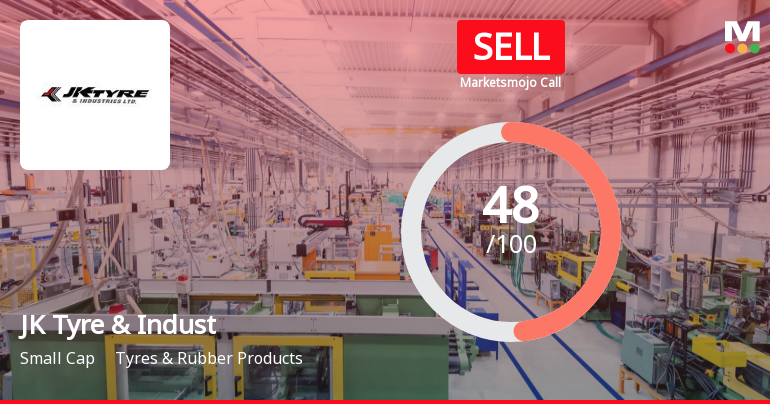
JK Tyre & Industries Ltd is Rated Sell
JK Tyre & Industries Ltd is rated 'Sell' by MarketsMOJO, with this rating last updated on 26 May 2026. However, the analysis and financial metrics discussed here reflect the stock's current position as of 30 June 2026, providing investors with an up-to-date view of the company’s fundamentals, valuation, financial trends, and technical outlook.
Read full news article Announcements
Closure of Trading Window
26-Jun-2026 | Source : BSEIntimation of Closure of Trading Window.
Announcement under Regulation 30 (LODR)-Credit Rating
26-Jun-2026 | Source : BSEDisclosure under Regulation 30 of the SEBI ( Listing Obligations and Disclosure Requirements) Regulations 2015 - Credit Ratings.
Announcement under Regulation 30 (LODR)-Credit Rating
12-Jun-2026 | Source : BSEDisclosure under Regulation 30 of the SEBI (Listing Obligations and Disclosure Requirements) Regulations 2015 - Credit Ratings.
Corporate Actions

No Upcoming Board Meetings

JK Tyre & Industries Ltd has declared 150% dividend, ex-date: 31 Jul 25

JK Tyre & Industries Ltd has announced 2:10 stock split, ex-date: 18 Dec 14

No Bonus history available

JK Tyre & Industries Ltd has announced 1:3 rights issue, ex-date: 07 Jul 08
Quality key factors
Valuation key factors
Technicals key factors
 Technical Indicator Scale: Bearish, Mildly Bearish, Sideways, Mildly Bullish, Bullish Turned
 Shareholding Snapshot : Mar 2026
Shareholding Compare (%holding)
Promoters
None
Held by 23 Schemes (7.0%)
Held by 176 FIIs (18.6%)
Bengal & Assam Company Ltd. (45.43%)
Hdfc Mutual Fund - Hdfc Multi Cap Fund & Hdfc Hybrid Equity Fund & Hdfc Transportation And Logistics (5.45%)
14.68%
Quarterly Results Snapshot (Consolidated) - Mar'26 - QoQ

QoQ Growth in quarter ended Mar 2026 is 0.01% vs 5.28% in Dec 2025
QoQ Growth in quarter ended Mar 2026 is -14.32% vs -8.44% in Dec 2025
Half Yearly Results Snapshot (Consolidated) - Sep'25

Growth in half year ended Sep 2025 is 8.53% vs -4.66% in Sep 2024
Growth in half year ended Sep 2025 is 11.62% vs -12.50% in Sep 2024
Nine Monthly Results Snapshot (Consolidated) - Dec'25
YoY Growth in nine months ended Dec 2025 is 10.69% vs -3.26% in Dec 2024
YoY Growth in nine months ended Dec 2025 is 48.97% vs -35.31% in Dec 2024
Annual Results Snapshot (Consolidated) - Mar'26
YoY Growth in year ended Mar 2026 is 11.12% vs -2.06% in Mar 2025
YoY Growth in year ended Mar 2026 is 52.34% vs -35.21% in Mar 2025
About JK Tyre & Industries Ltd

Company Coordinates


