
Compare Rain Industries with Similar Stocks
Dashboard
With a growth in Net Profit of 318.95%, the company declared Very Positive results in Mar 26
- The company has declared positive results for the last 4 consecutive quarters
- ROCE(HY) Highest at 7.85%
- OPERATING PROFIT TO INTEREST(Q) Highest at 2.92 times
- NET SALES(Q) Highest at Rs 4,520.73 cr
With ROCE of 7.7, it has a Very Attractive valuation with a 1 Enterprise value to Capital Employed
Majority shareholders : Non Institution
Market Beating performance in long term as well as near term
Stock DNA
Petrochemicals
INR 7,427 Cr (Small Cap)
25.00
40
0.45%
1.11
0.57%
1.01
Total Returns (Price + Dividend) 
Latest dividend: 0.9987337765115544 per share ex-dividend date: Aug-13-2025
Risk Adjusted Returns v/s
Returns Beta

News
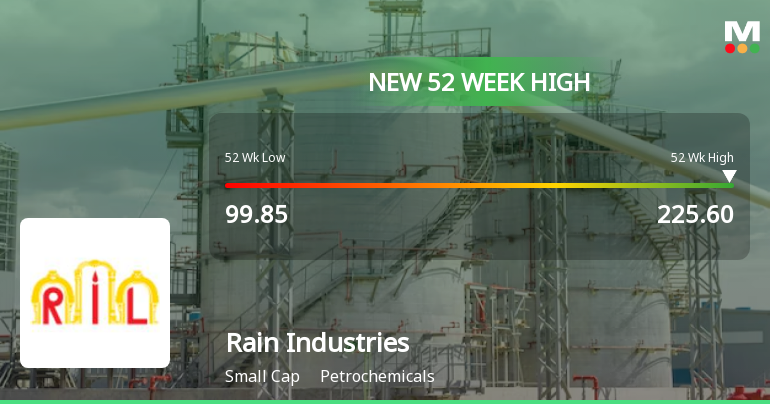
Broad-Based Technical Strength Lifts Rain Industries Ltd to 52-Week High of Rs 225.6
With a decisive break above Rs 225.6 on 24 Jul 2026, Rain Industries Ltd has reached a fresh 52-week high, extending its impressive 40.31% return over the past year. This milestone comes amid a backdrop of strong technical momentum and sustained earnings growth, setting the stage for continued market attention.
Read full news article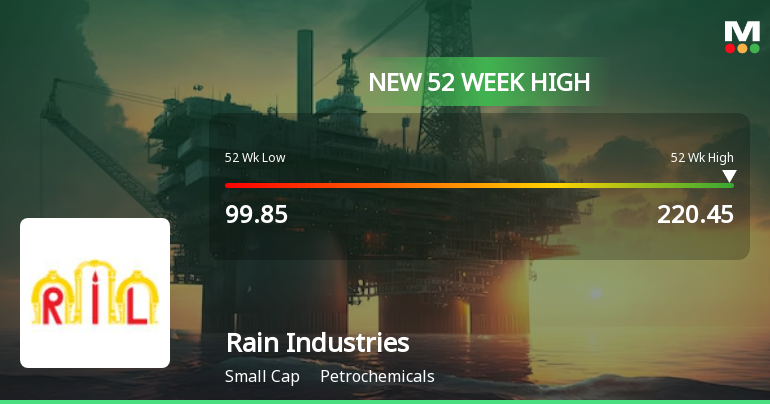
Broad-Based Technical Strength Lifts Rain Industries Ltd to 52-Week High of Rs 220.45
With a surge to Rs 220.45 on 21 Jul 2026, Rain Industries Ltd has reached a fresh 52-week high, marking a 120% rally from its low of Rs 99.85 over the past year. This milestone is underpinned by a confluence of strong technical indicators and sustained price momentum, setting the stock apart in a challenging market backdrop.
Read full news article
Rain Industries Ltd is Rated Strong Buy
Rain Industries Ltd is rated Strong Buy by MarketsMOJO, with this rating last updated on 17 June 2026. However, the analysis and financial metrics discussed here reflect the company’s current position as of 21 July 2026, providing investors with the latest insights into its performance and outlook.
Read full news article Announcements
Compliances-Certificate under Reg. 74 (5) of SEBI (DP) Regulations 2018
04-Jul-2026 | Source : BSERain Industries Limited - Confirmation Certificate under Regulation 74(5) of Securities and Exchange Board of India (Depositories and Participants) Regulations 2018 for the Quarter ended June 30 2026.
Board Meeting Intimation for Rain Industries Limited - Intimation Of Date Of The Board Meeting Inter-Alia To Approve The Un-Audited Financial Results (Standalone Consolidated And Segment) For The Second Quarter And Half Year Ended June 30 2026
29-Jun-2026 | Source : BSERain Industries Ltdhas informed BSE that the meeting of the Board of Directors of the Company is scheduled on 06/08/2026 inter alia to consider and approve the Un-Audited Financial Results (Standalone Consolidated and Segment) for the Second Quarter and half year ended June 30 2026.
Rain Industries Limited - Intimation Regarding Release Of Annual Sustainability Report By Rain Carbon Inc. Wholly Owned Subsidiary Company For The Financial Year Ended December 31 2025.
11-Jun-2026 | Source : BSERain Industries Limited - Intimation regarding release of Annual Sustainability Report by Rain Carbon Inc. Wholly Owned Subsidiary of the Company for the Financial Year ended December 31 2025.
Corporate Actions

06 Aug 2026

Rain Industries Ltd has declared 50% dividend, ex-date: 13 Aug 25

Rain Industries Ltd has announced 2:10 stock split, ex-date: 15 Jun 11

No Bonus history available

No Rights history available
Quality key factors
Valuation key factors
Technicals key factors
 Technical Indicator Scale: Bearish, Mildly Bearish, Sideways, Mildly Bullish, Bullish Turned
 Shareholding Snapshot : Jun 2026
Shareholding Compare (%holding)
Non Institution
None
Held by 10 Schemes (1.66%)
Held by 74 FIIs (8.02%)
Sujala Investments Private Limited (11.29%)
Meghamala Enterprises Private Limited (2.86%)
34.22%
Quarterly Results Snapshot (Consolidated) - Mar'26 - QoQ

QoQ Growth in quarter ended Mar 2026 is 5.12% vs -3.91% in Dec 2025
QoQ Growth in quarter ended Mar 2026 is 798.89% vs -87.26% in Dec 2025
Half Yearly Results Snapshot (Consolidated) - Jun'25
Growth in half year ended Jun 2025 is 5.22% vs -21.42% in Jun 2024
Growth in half year ended Jun 2025 is 65.59% vs -182.56% in Jun 2024
Nine Monthly Results Snapshot (Consolidated) - Sep'25
YoY Growth in nine months ended Sep 2025 is 8.09% vs -16.68% in Sep 2024
YoY Growth in nine months ended Sep 2025 is 107.20% vs -322.76% in Sep 2024
Annual Results Snapshot (Consolidated) - Dec'25
YoY Growth in year ended Dec 2025 is 10.22% vs -15.25% in Dec 2024
YoY Growth in year ended Dec 2025 is 107.54% vs 39.84% in Dec 2024
About Rain Industries Ltd

Company Coordinates


