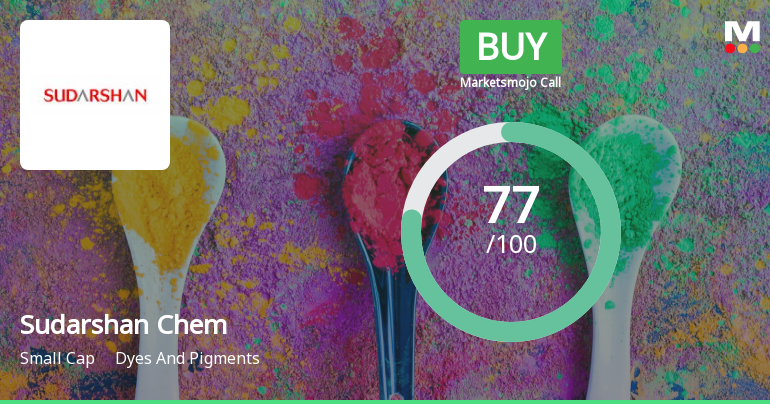
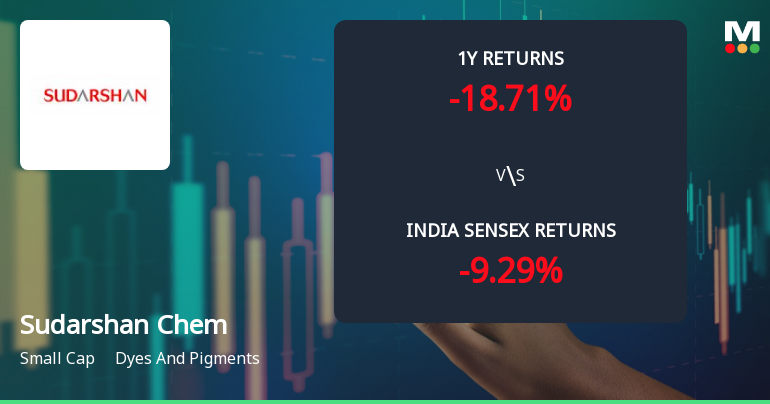
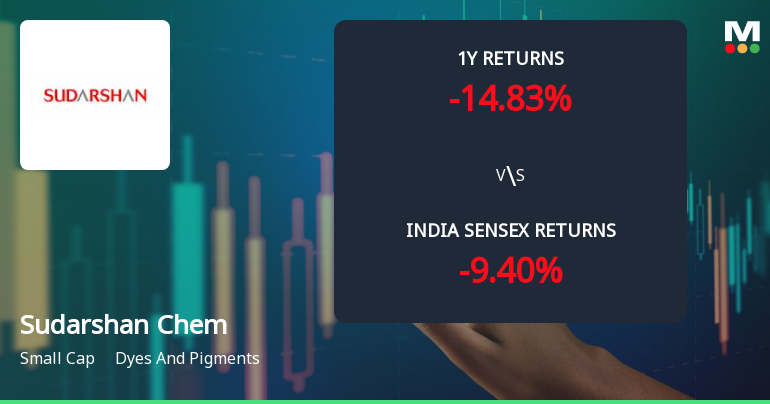
Sudarshan Chem

  • Market Cap: Small Cap
  • Industry: Dyes And Pigments
  • ISIN: INE659A01023
  • NSEID: SUDARSCHEM
  • BSEID: 506655
INR
1,062.55
17.85 (1.71%)
BSENSE

Aug 13, 01:40 PM

BSE+NSE Vol: 5.6 lacs

  • Price Points
  • Score
  • Mojo Parameters
  • Total Return
  • News and Corporate Actions
  • Key factors
  • Shareholding
  • Financials
  • CompanyCV
stock-summaryPrice Point
High/Low

1Day

52 Week

Valuation
Technical
Day's Volume

CASH

5.6 lacs (138.61%) Volume

Shareholding (Jun 2026)

FII

8.47%

Held by 96 FIIs

DII

26.42%

Held by 30 DIIs

Promoter

8.19%

Why is Sudarshan Chemical Industries Ltd falling/rising?

13-Aug-2026

As of 12-Aug, Sudarshan Chemical Industries Ltd's stock price is at 1,044.70, down 5.91% and underperforming its sector. The stock has seen a total decline of 7.61% over the last three days, indicating short-term weakness despite being above longer-term moving averages.

As of 12-Aug, Sudarshan Chemical Industries Ltd's stock price is falling, currently at 1,044.70, which reflects a decrease of 65.65 or 5.91%. The stock has been underperforming, having lost 3.84% over the past week compared to a 0.78% decline in the Sensex. Additionally, the stock has experienced a consecutive fall over the last three days, resulting in a total decline of 7.61% during this period.<BR><BR>Today's trading performance indicates that the stock has underperformed its sector by 3.02%. It reached an intraday low of Rs 1,033.2, marking a significant drop of 6.95%. Furthermore, the volume of delivery on August 11 was 1.04 lacs, which is a decrease of 35.15% compared to the five-day average, suggesting a decline in investor participation. The overall action in the Dyes & Pigments sector has also been negative, with a drop of 2.04%. <BR><BR>Despite being above the 50-day, 100-day, and 200-day moving averages, the stock is below the 5-day and 20-day moving averages, indicating a short-term weakness. These factors collectively contribute to the current downward trend in the stock price of Sudarshan Chemical Industries Ltd.

View full answer

Should I buy, sell or hold Sudarshan Chemical Industries Ltd?

13-Aug-2026

What does Sudarshan Chem do?

11-Jun-2026

Sudarshan Chemical Industries Ltd is a leading Indian manufacturer of organic and inorganic pigments and agrochemicals, with a market cap of INR 7,043 Cr and reported net sales of 2,790 Cr and net profit of 79 Cr for March 2026. The company has a P/E ratio of 112.00 and a dividend yield of 0.50%.

Overview:<BR>Sudarshan Chemical Industries Ltd is a leading player in the Dyes and Pigments industry, operating within the small-cap market segment, and specializes in the manufacture of a diverse range of Organic and Inorganic Pigments, Effect Pigments, and Agro Chemicals.<BR><BR>History:<BR>Sudarshan Chemical Industries Ltd was incorporated in an unspecified year and has established itself as the largest producer of pigments in India. The latest quarterly results reported are for March 2026, showcasing significant sales and profit figures.<BR><BR>Financial Snapshot:<BR>- Net Sales: 2,790 Cr (Quarterly Results - Mar 2026)<BR>- Net Profit: 79 Cr (Quarterly Results - Mar 2026)<BR>- Market Cap: INR 7,043 Cr (Small Cap)<BR><BR>Key Metrics:<BR>- P/E: 112.00<BR>- Industry P/E: 20<BR>- Dividend Yield: 0.50%<BR>- Debt-Equity: 0.31<BR>- Return on Equity: 1.74%<BR>- Price to Book: 2.04<BR><BR>Contact Details:<BR>- Address: 162 Wellesley Road, Pune Maharashtra: 411001<BR>- Tel: 91-20-26226200<BR>- Email: scil@giaspn01.vsnl.net.in<BR>- Website: http://www.sudarshan.com

View full answer

How big is Sudarshan Chem?

11-Jun-2026

As of 10th June, Sudarshan Chemical Industries Ltd has a market capitalization of 7,043.00 Cr, with net sales of 9,787.20 Cr and a net profit of 22.30 Cr over the latest four quarters.

As of 10th June, <BR><BR>Market Cap: Sudarshan Chemical Industries Ltd has a market capitalization of 7,043.00 Cr, classifying it as a Small Cap company.<BR><BR>Recent Quarterly Performance: The sum of Net Sales for the latest 4 quarters is 9,787.20 Cr, while the sum of Net Profit for the same period is 22.30 Cr.<BR><BR>Balance Sheet Snapshot: The reporting period for the balance sheet is March 2025. Shareholder's Funds stand at 3,440.05 Cr, and Total Assets amount to 9,671.74 Cr.

View full answer

Who are in the management team of Sudarshan Chem?

11-Jun-2026

The management team of Sudarshan Chemicals includes Chairman P R Rathi, Managing Director R B Rathi, and several independent directors, alongside a whole-time director and a company secretary, bringing diverse expertise to the company.

The management team of Sudarshan Chemicals includes the following members:<BR><BR>1. **P R Rathi** - Chairman (Non-Executive)<BR>2. **R B Rathi** - Managing Director<BR>3. **Ashish Vij** - Whole-time Director<BR>4. **D N Damania** - Independent Director<BR>5. **S Padmanabhan** - Independent Director<BR>6. **S K Asher** - Independent Director<BR>7. **Rati Farhad Forbes** - Independent Director<BR>8. **Naresh T Raisinghani** - Independent Director<BR>9. **Shubhalakshmi Panse** - Independent Director<BR>10. **Deepak Parikh** - Independent Director<BR>11. **Mandar Velankar** - Company Secretary & Compliance Officer<BR>12. **Anuj Narayandas Rathi** - Non-Executive & Non-Independent Director<BR><BR>This diverse board brings a wealth of experience and expertise to the company.

View full answer

Who are the peers of the Sudarshan Chem?

11-Jun-2026

Peers of Sudarshan Chem include Kiri Industries, Sh.Pushkar Chem., Ultramarine Pig., Bhageria Indust., Bodal Chemicals, Sudarshan Colora, Asahi Songwon, Poddar Pigments, and AksharChem (I). Sudarshan Chem has average management risk and growth, with a 1-year return of -30.74%, significantly lower than Bhageria Indust.'s 8.62%.

Peers: The peers of Sudarshan Chem are Kiri Industries, Sh.Pushkar Chem., Ultramarine Pig., Bhageria Indust., Bodal Chemicals, Sudarshan Colora, Asahi Songwon, Poddar Pigments, and AksharChem (I).<BR><BR>Quality Snapshot: Below Average management risk is observed at Kiri Industries and Bodal Chemicals, while Average management risk is found at Sudarshan Chem, Sh.Pushkar Chem., Ultramarine Pig., Bhageria Indust., Sudarshan Colora, Asahi Songwon, Poddar Pigments, and AksharChem (I). Below Average growth is noted at Kiri Industries, Bodal Chemicals, and AksharChem (I), while Average growth is seen at Sudarshan Chem, Sh.Pushkar Chem., Ultramarine Pig., and the rest. Excellent capital structure is present at Sh.Pushkar Chem., Ultramarine Pig., Bhageria Indust., Sudarshan Colora, and Poddar Pigments, while Average capital structure is noted at Sudarshan Chem and the rest.<BR><BR>Return Snapshot: Bhageria Indust. has the highest 1-year return at 8.62%, while Sudarshan Chem has the lowest at -30.74%. Sudarshan Chem's 1-year return is significantly lower than Bhageria Indust.'s. Additionally, Kiri Industries, Ultramarine Pig., Sudarshan Colora, Asahi Songwon, AksharChem (I), and Ducol Organics all have negative six-month returns.

View full answer

Are Sudarshan Chemical Industries Ltd latest results good or bad?

26-May-2026

Sudarshan Chemical Industries Ltd's latest results show strong revenue growth of 106.75% year-on-year, reaching ₹2,789.90 crores, but operating margins have contracted to 8.15% and a high tax rate has impacted net profit, raising concerns about sustainability. Investors should watch how the company addresses these challenges.

Sudarshan Chemical Industries Ltd's latest results present a mixed picture. On one hand, the company achieved impressive revenue growth, with net sales reaching ₹2,789.90 crores, marking a remarkable 106.75% increase year-on-year. This surge in revenue reflects the successful integration of BASF's pigments business, which has significantly expanded the company's scale and global footprint.<BR><BR>On the other hand, the operating margin has contracted to 8.15% from 9.41% a year ago, indicating challenges in managing costs and integration issues. Additionally, while the company reported a net profit of ₹78.70 crores, this was achieved despite facing an extraordinarily high tax rate of 50.81%, which has significantly impacted profitability.<BR><BR>Overall, while the revenue growth is a positive sign, the compression in margins and high tax burden raise concerns about the sustainability of this performance. Investors may need to monitor how effectively the company can navigate these challenges moving forward.

View full answer

When is the next results date for Sudarshan Chemical Industries Ltd?

19-May-2026

The next results date for Sudarshan Chemical Industries Ltd is 25 May 2026.

The next results date for Sudarshan Chemical Industries Ltd is scheduled for 25 May 2026.

View full answer

Is Sudarshan Chem technically bullish or bearish?

03-Dec-2025

As of December 2, 2025, Sudarshan Chem's trend has shifted to mildly bearish, with key indicators like the MACD, RSI, and Bollinger Bands showing bearish signals on both weekly and monthly charts, despite mildly bullish daily moving averages.

As of 2 December 2025, the technical trend for Sudarshan Chem has changed from sideways to mildly bearish. The current stance is mildly bearish, driven by several key indicators. The MACD is bearish on the weekly chart and mildly bearish on the monthly chart. The RSI is bearish on the weekly timeframe, indicating weakness, while the Bollinger Bands are bearish across both weekly and monthly periods. Additionally, the KST and OBV are both bearish on the weekly chart and mildly bearish on the monthly chart. The only positive note comes from the daily moving averages, which are mildly bullish, but this is overshadowed by the overall bearish signals in the longer time frames.

View full answer

How has been the historical performance of Sudarshan Chem?

13-Nov-2025

Sudarshan Chem has experienced significant growth in net sales, rising from 1,593.05 Cr in Mar'19 to 3,345.58 Cr in Mar'25, but profitability has faced challenges due to soaring raw material costs, with profit after tax dropping from 357.45 Cr in Mar'24 to 57.30 Cr in Mar'25. Total assets increased substantially to 9,671.74 Cr in Mar'25, reflecting strong asset growth despite declining profit margins.

Answer:<BR>The historical performance of Sudarshan Chem shows significant growth in net sales and profits over the years, with a notable increase in recent years.<BR><BR>Breakdown:<BR>Sudarshan Chem's net sales have consistently risen from 1,593.05 Cr in Mar'19 to 3,345.58 Cr in Mar'25, reflecting a strong upward trend. The total operating income followed a similar trajectory, reaching 3,345.58 Cr in Mar'25, up from 2,538.78 Cr in Mar'24. However, the raw material costs surged dramatically to 3,317.74 Cr in Mar'25 from 1,380.49 Cr in Mar'24, impacting the operating profit, which stood at 381.03 Cr in Mar'25 compared to 316.42 Cr in Mar'24. Profit before tax saw a decline to 96.30 Cr in Mar'25 from 470.53 Cr in Mar'24, while profit after tax dropped to 57.30 Cr from 357.45 Cr in the previous year. The company's total assets increased significantly to 9,671.74 Cr in Mar'25 from 2,345.82 Cr in Mar'24, driven by a rise in current assets and long-term borrowings, which surged to 1,631.89 Cr in Mar'25 from 193.31 Cr in Mar'24. Cash flow from operating activities decreased to 37.00 Cr in Mar'25 from 193.00 Cr in Mar'24, while cash flow from financing activities showed a substantial increase to 2,595.00 Cr in Mar'25 from -445.00 Cr in Mar'24, resulting in a net cash inflow of 1,057.00 Cr in Mar'25, up from 26.00 Cr in Mar'24. Overall, while Sudarshan Chem has shown impressive growth in sales and assets, the profitability metrics indicate challenges in maintaining profit margins amidst rising costs.

View full answer

Is Sudarshan Chem overvalued or undervalued?

09-Jun-2025

As of February 15, 2024, Sudarshan Chemical is considered overvalued with a valuation grade of expensive, reflected in its high PE ratio of 71.32, Price to Book Value of 7.59, and EV to EBITDA of 25.68, especially compared to lower metrics of its industry peers.

As of 15 February 2024, the valuation grade for Sudarshan Chemical has moved from fair to expensive, indicating that the company is currently overvalued. The key ratios reflect this assessment, with a PE ratio of 71.32, a Price to Book Value of 7.59, and an EV to EBITDA of 25.68. These figures suggest that the stock is trading at a significant premium compared to its earnings and book value.<BR><BR>In comparison to its peers in the Dyes and Pigments industry, Sudarshan Chem's valuation appears high, particularly when considering its PEG ratio of 2.40. Notably, competitors in the same sector exhibit lower valuation metrics, reinforcing the notion that Sudarshan Chem is overvalued. Additionally, while the company's stock has outperformed the Sensex with a one-year return of 60.23% compared to the Sensex's 7.60%, this strong performance does not justify the elevated valuation levels.

View full answer

Who are the top shareholders of the Sudarshan Chem?

06-Jun-2025

The top shareholders of Sudarshan Chemical include individual investors (33.55%), mutual funds (21.57%), and foreign institutional investors (7.95%). Promoter Anuj Narayandas Rathi holds 6.93%, while HDFC Small Cap Fund is the largest public shareholder with 7.3%, and there are no pledged promoter holdings.

The top shareholders of Sudarshan Chemical include a mix of institutional and individual investors. The largest portion of shares is held by individual investors, accounting for 33.55%. Among institutional investors, mutual funds hold 21.57% through 13 different schemes, while foreign institutional investors (FIIs) have a stake of 7.95% across 100 entities. <BR><BR>Promoter Anuj Narayandas Rathi is the individual with the highest holding among promoters, owning 6.93% of the company. Additionally, HDFC Small Cap Fund is the highest public shareholder, holding 7.3%. Notably, there are no pledged promoter holdings reported.

View full answer

What is the bonus history of the Sudarshan Chem?

06-Jun-2025

Sudarshan Chemical Industries Ltd has a bonus history that includes a 1:1 bonus issue announced on September 30, 2014, with a record date of October 1, 2014, allowing shareholders to receive one additional share for each share held.

Sudarshan Chemical Industries Ltd has a bonus history that includes a 1:1 bonus issue. This was announced with an ex-date of September 30, 2014, and the record date was October 1, 2014. This means that shareholders received one additional share for every share they held as of the record date.

View full answer

Has Sudarshan Chem declared dividend?

06-Jun-2025

Yes, Sudarshan Chemical Industries Ltd has declared a 50% dividend, amounting to ₹1 per share, with an ex-date of July 26, 2024. The dividend yield is 0.07%, and the company has shown strong price appreciation over various periods.

Sudarshan Chemical Industries Ltd has declared a 50% dividend.<BR><BR>Dividend Details:<BR>- Percentage announced: 50%<BR>- Amount per share: 1 per share<BR>- Ex-date: Jul-26-2024<BR><BR>Dividend Yield: 0.07%.<BR><BR>Total Returns by Period:<BR>In the last 6 months, the price return was 4.94%, with no dividend return, resulting in a total return of 4.94%.<BR><BR>Over the past year, the price return was 50.23%, with a dividend return of 0.12%, leading to a total return of 50.35%.<BR><BR>In the 2-year period, the price return was 136.57%, with a dividend return of 0.91%, culminating in a total return of 137.48%.<BR><BR>For the 3-year period, the price return was 156.84%, with a dividend return of 2.24%, resulting in a total return of 159.08%.<BR><BR>In the last 4 years, the price return was 68.47%, with a dividend return of 2.28%, leading to a total return of 70.75%.<BR><BR>Over the 5-year period, the price return was 199.97%, with a dividend return of 4.00%, resulting in a total return of 203.97%.<BR><BR>Overall, Sudarshan Chemical Industries Ltd has declared a dividend, and while the dividend yield is relatively low, the total returns over various periods indicate strong price appreciation, particularly over the longer term.

View full answer
iScoreScore
Click here to find our call on this stock
Strong Sell
Sell
Hold
Buy
Strong Buy

Dashboard

1

With a growth in Net Profit of 88.31%, the company declared Outstanding results in Jun 26

  • The company has declared positive results for the last 2 consecutive quarters
  • NET SALES(Latest six months) At Rs 5,432.00 cr has Grown at 40.86%
  • PBT LESS OI(Q) At Rs 138.40 cr has Grown at 145.39%
  • OPERATING PROFIT TO INTEREST(Q) Highest at 6.39 times
2

With ROCE of 5.4, it has a Fair valuation with a 2.1 Enterprise value to Capital Employed

3

High Institutional Holdings at 34.9%

4

Underperformed the market in the last 1 year

stock-summaryMojo Parameters

Mojo Parameters

Loading Valuation Snapshot...

Stock DNA

stock-summary
Industry

Dyes And Pigments

stock-summary
Market cap

INR 8,459 Cr (Small Cap)

stock-summary
P/E

140.00

stock-summary
Industry P/E

20

stock-summary
Dividend Yield

0.90%

stock-summary
Debt Equity

0.31

stock-summary
Return on Equity

1.74%

stock-summary
Price to Book

2.43

Revenue and Profits:
Net Sales:
2,642 Cr
(Quarterly Results - Jun 2026)
Net Profit:
97 Cr
stock-summaryTotal Returns
Total Returns (Price + Dividend) stock-summary
Dividend Yield (0.9%)
TimePeriod
Price Return
Dividend Return
Total Return
3 Months
21.23%
0.57%
21.8%
6 Months
14.78%
0.54%
15.32%
1 Year
-26.45%
0.65%
-25.8%
2 Years
9.65%
0.94%
10.59%
3 Years
103.69%
2.74%
106.43%
4 Years
131.32%
3.04%
134.36%
5 Years
65.18%
2.85%
68.03%

Latest dividend: 4.988095238095238 per share ex-dividend date: Aug-11-2026

Risk Adjusted Returns v/s stock-summary
Returns Beta
Icon
Beta has not been calculated since enough price history is not available
stock-summaryNews & Corporate Actions

Announcements stock-summary

Announcement under Regulation 30 (LODR)-Analyst / Investor Meet - Intimation

10-Aug-2026 | Source : BSE

Schedule of Analyst / Institutional Investors call in respect of unaudited financial results for the quarter ended 30 June 2026

TDS Communication To Shareholders

06-Aug-2026 | Source : BSE

TDS Communication to Shareholders - Final Dividend FY25-26

Board Meeting Intimation for Prior Intimation Of Board Meeting - Regulation 29

05-Aug-2026 | Source : BSE

Sudarshan Chemical Industries Ltdhas informed BSE that the meeting of the Board of Directors of the Company is scheduled on 12/08/2026 inter alia to consider and approve This is to inform you that meeting of the Board of Directors is scheduled on Wednesday 12th August 2026 inter alia to consider and approve Q1 FY27 results.

Corporate Actions stock-summary

stock-summary
BOARD MEETING

No Upcoming Board Meetings

stock-summary
DIVIDEND

Sudarshan Chemical Industries Ltd has declared 250% dividend, ex-date: 11 Aug 26

stock-summary
SPLITS

Sudarshan Chemical Industries Ltd has announced 2:10 stock split, ex-date: 30 Sep 14

stock-summary
BONUS

Sudarshan Chemical Industries Ltd has announced 1:1 bonus issue, ex-date: 30 Sep 14

stock-summary
RIGHTS

No Rights history available

stock-summaryKey Factors

Quality key factors stock-summary

Factor
Value
Sales Growth (5y)
39.33%
EBIT Growth (5y)
3.82%
EBIT to Interest (avg)
4.51
Debt to EBITDA (avg)
3.44
Net Debt to Equity (avg)
0.31
Sales to Capital Employed (avg)
1.32
Tax Ratio
73.95%
Dividend Payout Ratio
63.42%
Pledged Shares
0
Institutional Holding
34.90%
ROCE (avg)
8.75%
ROE (avg)
6.92%

Valuation key factors

Factor
Value
P/E Ratio
140
Industry P/E
20
Price to Book Value
2.43
EV to EBIT
38.92
EV to EBITDA
16.01
EV to Capital Employed
2.09
EV to Sales
0.97
PEG Ratio
NA
Dividend Yield
0.90%
ROCE (Latest)
5.36%
ROE (Latest)
1.74%

Technicals key factors

Indicator
Weekly
Monthly
MACD
Bullish
Mildly Bearish
RSI
No Signal
No Signal
Bollinger Bands
Mildly Bullish
Sideways
Moving Averages
Bullish (Daily)
KST
Bullish
Mildly Bearish
Dow Theory
Mildly Bullish
Mildly Bullish
OBV
No Trend
Bullish
stock-summary Technical Indicator Scale: Bearish, Mildly Bearish, Sideways, Mildly Bullish, Bullish  Turned 
stock-summaryShareholding
Shareholding Snapshot : Jun 2026stock-summary
Shareholding Compare (%holding) stock-summary
Majority shareholders

Non Institution

Pledged Promoter Holdings

None

Mutual Funds

Held by 12 Schemes (25.17%)

FIIs

Held by 96 FIIs (8.47%)

Promoter with highest holding

Rajesh Balkrishna Rathi (5.15%)

Highest Public shareholder

Tata Mutual Fund - Tata Small Cap Fund (7.72%)

Individual Investors Holdings

44.52%

stock-summaryFinancial
[
  {
    "link": "quarterly",
    "btn_text": "All Quarterly Results",
    "header": "Quarterly Results Snapshot (Consolidated) - Jun'26 - YoY",
    "rhs": [
      {
        "prefix": "Net Sales ",
        "suffix": "YoY Growth in quarter ended Jun 2026 is 5.39% vs 295.65% in Jun 2025",
        "dir": -1
      },
      {
        "prefix": "Consolidated Net Profit ",
        "suffix": "YoY Growth in quarter ended Jun 2026 is 106.14% vs 60.38% in Jun 2025",
        "dir": 1
      }
    ],
    "table": {
      "header": [
        "Jun'26",
        "Jun'25",
        "Change(%)"
      ],
      "body": [
        {
          "field": "Net Sales",
          "val1": "2,642.10",
          "val2": "2,506.90",
          "chgp": "5.39%",
          "chgp_class": "positive"
        },
        {
          "field": "Operating Profit (PBDIT) excl Other Income",
          "val1": "258.80",
          "val2": "192.40",
          "chgp": "34.51%",
          "chgp_class": "positive"
        },
        {
          "field": "Interest",
          "val1": "40.50",
          "val2": "44.10",
          "chgp": "-8.16%",
          "chgp_class": "positive"
        },
        {
          "field": "Exceptional Items",
          "val1": "0.00",
          "val2": "0.00",
          "chgp": "",
          "chgp_class": "neutral"
        },
        {
          "field": "Consolidate Net Profit",
          "val1": "97.30",
          "val2": "47.20",
          "chgp": "106.14%",
          "chgp_class": "positive"
        },
        {
          "field": "Operating Profit Margin (Excl OI)",
          "val1": "9.80%",
          "val2": "7.67%",
          "chgp": "2.13%",
          "chgp_class": "positive"
        }
      ]
    }
  },
  {
    "link": "half-yearly",
    "btn_text": "All Half Yearly Results",
    "header": "Half Yearly Results Snapshot (Consolidated) - Sep'25",
    "rhs": [
      {
        "prefix": "Net Sales ",
        "suffix": " Growth in half year ended Sep 2025 is 268.07% vs 10.00% in Sep 2024",
        "dir": 1
      },
      {
        "prefix": "Consolidated Net Profit ",
        "suffix": " Growth in half year ended Sep 2025 is -0.74% vs -79.17% in Sep 2024",
        "dir": 1
      }
    ],
    "table": {
      "header": [
        "Sep'25",
        "Sep'24",
        "Change(%)"
      ],
      "body": [
        {
          "field": "Net Sales",
          "val1": "4,894.30",
          "val2": "1,329.71",
          "chgp": "268.07%",
          "chgp_class": "positive"
        },
        {
          "field": "Operating Profit (PBDIT) excl Other Income",
          "val1": "324.60",
          "val2": "175.05",
          "chgp": "85.43%",
          "chgp_class": "positive"
        },
        {
          "field": "Interest",
          "val1": "87.70",
          "val2": "15.92",
          "chgp": "450.88%",
          "chgp_class": "negative"
        },
        {
          "field": "Exceptional Items",
          "val1": "0.00",
          "val2": "-11.16",
          "chgp": "100.00%",
          "chgp_class": "positive"
        },
        {
          "field": "Consolidate Net Profit",
          "val1": "58.90",
          "val2": "59.34",
          "chgp": "-0.74%",
          "chgp_class": "negative"
        },
        {
          "field": "Operating Profit Margin (Excl OI)",
          "val1": "6.63%",
          "val2": "13.31%",
          "chgp": "-6.68%",
          "chgp_class": "negative"
        }
      ]
    }
  },
  {
    "link": "nine-monthly",
    "btn_text": "All Nine Monthly Results",
    "header": "Nine Monthly Results Snapshot (Consolidated) - Dec'25",
    "rhs": [
      {
        "prefix": "Net Sales ",
        "suffix": "YoY Growth in nine months ended Dec 2025 is 250.54% vs 12.49% in Dec 2024",
        "dir": 1
      },
      {
        "prefix": "Consolidated Net Profit ",
        "suffix": "YoY Growth in nine months ended Dec 2025 is -194.24% vs -80.01% in Dec 2024",
        "dir": -1
      }
    ],
    "table": {
      "header": [
        "Dec'25",
        "Dec'24",
        "Change(%)"
      ],
      "body": [
        {
          "field": "Net Sales",
          "val1": "6,997.30",
          "val2": "1,996.14",
          "chgp": "250.54%",
          "chgp_class": "positive"
        },
        {
          "field": "Operating Profit (PBDIT) excl Other Income",
          "val1": "362.50",
          "val2": "254.04",
          "chgp": "42.69%",
          "chgp_class": "positive"
        },
        {
          "field": "Interest",
          "val1": "124.10",
          "val2": "27.33",
          "chgp": "354.08%",
          "chgp_class": "negative"
        },
        {
          "field": "Exceptional Items",
          "val1": "-45.40",
          "val2": "-41.99",
          "chgp": "-8.12%",
          "chgp_class": "negative"
        },
        {
          "field": "Consolidate Net Profit",
          "val1": "-56.40",
          "val2": "59.85",
          "chgp": "-194.24%",
          "chgp_class": "negative"
        },
        {
          "field": "Operating Profit Margin (Excl OI)",
          "val1": "5.18%",
          "val2": "12.73%",
          "chgp": "-7.55%",
          "chgp_class": "negative"
        }
      ]
    }
  },
  {
    "link": "annual",
    "btn_text": "All Annual Results",
    "header": "Annual Results Snapshot (Consolidated) - Mar'26",
    "rhs": [
      {
        "prefix": "Net Sales ",
        "suffix": "YoY Growth in year ended Mar 2026 is 192.54% vs 31.78% in Mar 2025",
        "dir": 1
      },
      {
        "prefix": "Consolidated Net Profit ",
        "suffix": "YoY Growth in year ended Mar 2026 is -60.00% vs -84.40% in Mar 2025",
        "dir": 1
      }
    ],
    "table": {
      "header": [
        "Mar'26",
        "Mar'25",
        "Change(%)"
      ],
      "body": [
        {
          "field": "Net Sales",
          "val1": "9,787.20",
          "val2": "3,345.58",
          "chgp": "192.54%",
          "chgp_class": "positive"
        },
        {
          "field": "Operating Profit (PBDIT) excl Other Income",
          "val1": "589.90",
          "val2": "381.03",
          "chgp": "54.82%",
          "chgp_class": "positive"
        },
        {
          "field": "Interest",
          "val1": "164.90",
          "val2": "48.29",
          "chgp": "241.48%",
          "chgp_class": "negative"
        },
        {
          "field": "Exceptional Items",
          "val1": "-29.70",
          "val2": "-103.63",
          "chgp": "71.34%",
          "chgp_class": "positive"
        },
        {
          "field": "Consolidate Net Profit",
          "val1": "22.30",
          "val2": "55.75",
          "chgp": "-60.00%",
          "chgp_class": "negative"
        },
        {
          "field": "Operating Profit Margin (Excl OI)",
          "val1": "6.03%",
          "val2": "11.39%",
          "chgp": "-5.36%",
          "chgp_class": "negative"
        }
      ]
    }
  }
]

Quarterly Results Snapshot (Consolidated) - Jun'26 - YoYstock-summary

Jun'26
Jun'25
Change(%)
Net Sales
2,642.10
2,506.90
5.39%
Operating Profit (PBDIT) excl Other Income
258.80
192.40
34.51%
Interest
40.50
44.10
-8.16%
Exceptional Items
0.00
0.00
Consolidate Net Profit
97.30
47.20
106.14%
Operating Profit Margin (Excl OI)
9.80%
7.67%
2.13%
Values in Rs Cr.
Direction Arrows
Net Sales

YoY Growth in quarter ended Jun 2026 is 5.39% vs 295.65% in Jun 2025

Direction Arrows
Consolidated Net Profit

YoY Growth in quarter ended Jun 2026 is 106.14% vs 60.38% in Jun 2025

Half Yearly Results Snapshot (Consolidated) - Sep'25stock-summary

Sep'25
Sep'24
Change(%)
Net Sales
4,894.30
1,329.71
268.07%
Operating Profit (PBDIT) excl Other Income
324.60
175.05
85.43%
Interest
87.70
15.92
450.88%
Exceptional Items
0.00
-11.16
100.00%
Consolidate Net Profit
58.90
59.34
-0.74%
Operating Profit Margin (Excl OI)
6.63%
13.31%
-6.68%
Values in Rs Cr.
Direction Arrows
Net Sales

Growth in half year ended Sep 2025 is 268.07% vs 10.00% in Sep 2024

Direction Arrows
Consolidated Net Profit

Growth in half year ended Sep 2025 is -0.74% vs -79.17% in Sep 2024

Nine Monthly Results Snapshot (Consolidated) - Dec'25stock-summary

Dec'25
Dec'24
Change(%)
Net Sales
6,997.30
1,996.14
250.54%
Operating Profit (PBDIT) excl Other Income
362.50
254.04
42.69%
Interest
124.10
27.33
354.08%
Exceptional Items
-45.40
-41.99
-8.12%
Consolidate Net Profit
-56.40
59.85
-194.24%
Operating Profit Margin (Excl OI)
5.18%
12.73%
-7.55%
Values in Rs Cr.
Direction Arrows
Net Sales

YoY Growth in nine months ended Dec 2025 is 250.54% vs 12.49% in Dec 2024

Direction Arrows
Consolidated Net Profit

YoY Growth in nine months ended Dec 2025 is -194.24% vs -80.01% in Dec 2024

Annual Results Snapshot (Consolidated) - Mar'26stock-summary

Mar'26
Mar'25
Change(%)
Net Sales
9,787.20
3,345.58
192.54%
Operating Profit (PBDIT) excl Other Income
589.90
381.03
54.82%
Interest
164.90
48.29
241.48%
Exceptional Items
-29.70
-103.63
71.34%
Consolidate Net Profit
22.30
55.75
-60.00%
Operating Profit Margin (Excl OI)
6.03%
11.39%
-5.36%
Values in Rs Cr.
Direction Arrows
Net Sales

YoY Growth in year ended Mar 2026 is 192.54% vs 31.78% in Mar 2025

Direction Arrows
Consolidated Net Profit

YoY Growth in year ended Mar 2026 is -60.00% vs -84.40% in Mar 2025

stock-summaryCompany CV
About Sudarshan Chemical Industries Ltd stock-summary
stock-summary
Sudarshan Chemical Industries Ltd

Small Cap
Dyes And Pigments
Sudarshan Chemical Industries Limited is a globally renowned player in the Pigment Industry and manufactures a wide range of Organic and Inorganic Pigments, Effect Pigments, Agro Chemicals and other products with 2 facilities at Roha and Mahad, in Maharashtra. As the largest producer of pigments in India, the Company manufactures an extensive range of Organic, Inorganic and Effect Pigments and dispersions catering to the Coatings, Plastics, Inks and Cosmetics Industries worldwide.
Company Coordinates stock-summary
Company Details
162 Wellesley Road , Pune Maharashtra : 411001
stock-summary
Tel: 91-20-26226200
stock-summary
scil@giaspn01.vsnl.net.in
Registrar Details
Link Intime India Pvt Ltd, Block No 202, 2nd Floor, Akshay Complex, Near Ganesh Temple, Off Dhole Patil Road , Pune