
Compare Shilpa Medicare with Similar Stocks
Dashboard
Weak Long Term Fundamental Strength with an average Return on Capital Employed (ROCE) of 5.44%
- Poor long term growth as Net Sales has grown by an annual rate of 11.30% and Operating profit at 19.78% over the last 5 years
With a growth in Net Profit of 99.09%, the company declared Very Positive results in Mar 26
With ROCE of 9.8, it has a Expensive valuation with a 3.9 Enterprise value to Capital Employed
Majority shareholders : Non Institution
Consistent Returns over the last 3 years
Stock DNA
Pharmaceuticals & Biotechnology
INR 12,135 Cr (Small Cap)
52.00
37
0.08%
0.24
8.89%
4.63
Total Returns (Price + Dividend) 
Latest dividend: 0.5000060927313714 per share ex-dividend date: Sep-17-2025
Risk Adjusted Returns v/s
Returns Beta

News

Shilpa Medicare Ltd is Rated Hold
Shilpa Medicare Ltd is rated 'Hold' by MarketsMOJO, with this rating last updated on 06 May 2026. However, the analysis and financial metrics discussed below reflect the company’s current position as of 03 August 2026, providing investors with an up-to-date view of its fundamentals, returns, and market standing.
Read full news article
Shilpa Medicare Ltd is Rated Hold by MarketsMOJO
Shilpa Medicare Ltd is rated 'Hold' by MarketsMOJO, with this rating last updated on 06 May 2026. However, the analysis and financial metrics discussed below reflect the stock's current position as of 23 July 2026, providing investors with an up-to-date view of the company’s fundamentals, returns, and market performance.
Read full news article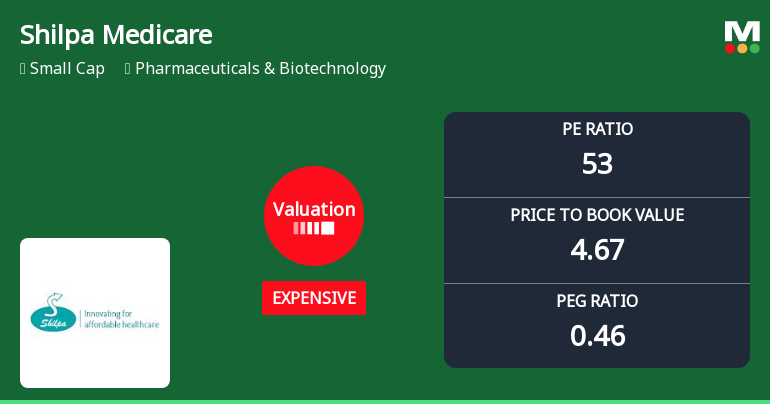
Shilpa Medicare Ltd Valuation Shifts Amidst Strong Market Returns
Shilpa Medicare Ltd has witnessed a notable shift in its valuation parameters, moving from a very expensive to an expensive rating. This change reflects evolving market perceptions amid strong stock returns and a competitive pharmaceutical sector landscape. A detailed analysis of its price-to-earnings (P/E), price-to-book value (P/BV), and other key metrics against historical and peer averages reveals the nuances behind this valuation adjustment and what it means for investors.
Read full news article Announcements
Board Meeting Intimation for Quarterly Financial Results
29-Jul-2026 | Source : BSEShilpa Medicare Ltdhas informed BSE that the meeting of the Board of Directors of the Company is scheduled on 05/08/2026 inter alia to consider and approve Unaudited financial results for the Quarter ended 30 June 2026
Announcement under Regulation 30 (LODR)-Analyst / Investor Meet - Intimation
29-Jul-2026 | Source : BSEInvestor conference call for Q1-FY27 is scheduled to be held on 05 August 2026
Announcement under Regulation 30 (LODR)-Credit Rating
16-Jul-2026 | Source : BSECredit Rating
Corporate Actions

05 Aug 2026

Shilpa Medicare Ltd has declared 100% dividend, ex-date: 17 Sep 25

Shilpa Medicare Ltd has announced 1:2 stock split, ex-date: 06 Nov 15

Shilpa Medicare Ltd has announced 1:1 bonus issue, ex-date: 03 Oct 25

No Rights history available
Quality key factors
Valuation key factors
Technicals key factors
 Technical Indicator Scale: Bearish, Mildly Bearish, Sideways, Mildly Bullish, Bullish Turned
 Shareholding Snapshot : Jun 2026
Shareholding Compare (%holding)
Non Institution
8.7265
Held by 11 Schemes (4.21%)
Held by 108 FIIs (11.38%)
Vishnukant Chaturbhuj Bhutada (6.51%)
Suraj Kumar Inani (4.01%)
27.67%
Quarterly Results Snapshot (Consolidated) - Mar'26 - QoQ

QoQ Growth in quarter ended Mar 2026 is 6.51% vs 10.90% in Dec 2025

QoQ Growth in quarter ended Mar 2026 is 141.79% vs 1.16% in Dec 2025
Half Yearly Results Snapshot (Consolidated) - Sep'25
Growth in half year ended Sep 2025 is 8.66% vs 11.02% in Sep 2024
Growth in half year ended Sep 2025 is 184.22% vs 1,046.95% in Sep 2024
Nine Monthly Results Snapshot (Consolidated) - Dec'25
YoY Growth in nine months ended Dec 2025 is 15.29% vs 11.13% in Dec 2024
YoY Growth in nine months ended Dec 2025 is 112.50% vs 765.40% in Dec 2024
Annual Results Snapshot (Consolidated) - Mar'26
YoY Growth in year ended Mar 2026 is 19.62% vs 11.71% in Mar 2025
YoY Growth in year ended Mar 2026 is 210.81% vs 145.65% in Mar 2025
About Shilpa Medicare Ltd

Company Coordinates


