
Compare Frontline Corp. with Similar Stocks
Dashboard
High Debt company with Weak Long Term Fundamental Strength
- Poor long term growth as Operating profit has grown by an annual rate 14.73% of over the last 5 years
- High Debt Company with a Debt to Equity ratio (avg) of 4.67 times
- The company has been able to generate a Return on Capital Employed (avg) of 0.08% signifying low profitability per unit of total capital (equity and debt)
Flat results in Dec 25
Risky - Negative Operating Profits
Underperformed the market in the last 1 year
Stock DNA
Transport Services
INR 19 Cr (Micro Cap)
7.00
20
0.00%
3.19
14.90%
1.12
Total Returns (Price + Dividend) 
Frontline Corp. for the last several years.
Risk Adjusted Returns v/s
Returns Beta

News
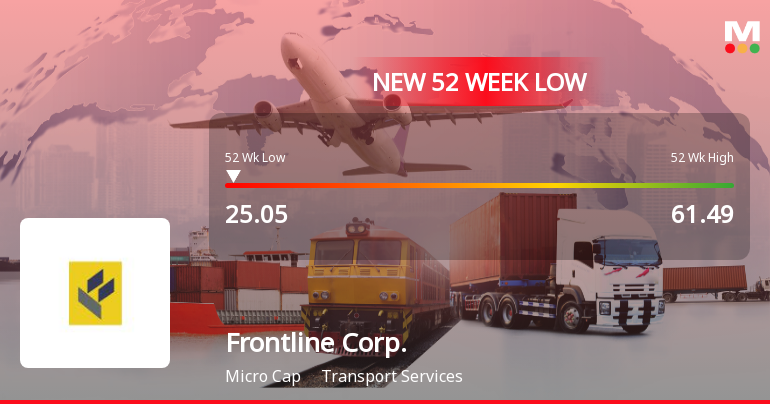
Frontline Corporation Ltd Falls to 52-Week Low Amidst Continued Downtrend
Frontline Corporation Ltd, a key player in the Transport Services sector, has declined to a fresh 52-week low of Rs.25.05, marking a significant downturn in its stock performance amid broader market and sector pressures.
Read full news article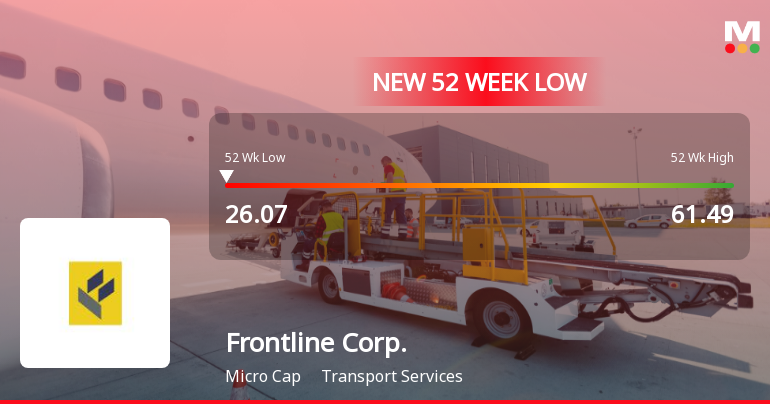
Frontline Corporation Ltd Stock Falls to 52-Week Low of Rs.26.07
Frontline Corporation Ltd, a key player in the Transport Services sector, has reached a new 52-week low of Rs.26.07, marking a significant decline in its stock price amid broader market fluctuations and sectoral pressures.
Read full news article Announcements
Board Meeting Intimation for Board Meeting For Consideration Of Audited Results For Period Ended 31St March 2026
22-May-2026 | Source : BSEFrontline Corporation Ltdhas informed BSE that the meeting of the Board of Directors of the Company is scheduled on 30/05/2026 inter alia to consider and approve Board Meeting for consideration of audited results for period ended 31st March 2026
Format of the Annual Disclosure to be made by an entity identified as a LC - Annexure B2
14-May-2026 | Source : BSEFormat of the Annual Disclosure to be made by an entity identified as a Large Corporate.
| Sr. No. | Particulars | Details |
| 1 | Name of Company | Frontline Corporation Ltd |
| 2 | CIN NO. | L63090WB1989PLC099645 |
| 3 | Report filed for FY | 2025-2026 |
| Details of the Current block (all figures in Rs crore): | ||
| 4 | 2 - year block period (Specify financial years)* | 2025-2026 |
| 5 | Incremental borrowing done in FY (T)(a) | 0.00 |
| 6 | Mandatory borrowing to be done through debt securities in FY (T) (b) = (25% of a) | 0.00 |
| 7 | Actual borrowing done through debt securities in FY (T)(c) | 0.00 |
| 8 | Shortfall in the borrowing through debt securities if any for FY (T - 1) carried forward to FY (T) (d) | NA |
| 8 | Quantum of (d) which has been met from (c)(e)* | NA |
| 9 | Shortfall if any in the mandatory borrowing through debt securities for FY (T) { after adjusting for any shortfall in borrowing for FY(T - 1) which was carried forward to FY(T)}(f) = (b) - [(c) - (e)]{ If the calculated value is zero or negative write nil}* | NA |
| Details of penalty to be paid if any in respect to previous block (all figures in Rs crore): | |
| 2 - year Block period (Specify financial years) | 2025-2026 |
| Amount of fine to be paid for the block if applicable Fine = 0.2% of {(d) - (e)}# | 0.00 |
| Name of the Company Secretary :- | Suresh Kumar Verma |
| Designation :- | Company Secretary and Compliance Officer |
| Name of the Chief Financial Officer :- | Komal Mihir Shah |
| Designation : - | Cheif Financial Officer |
Date: 14/05/2026
Proceeds Of Issue For Quarter Ended 31.03.2026
30-Apr-2026 | Source : BSEProceeds of Issue for Quarter ended 31.03.2026
Corporate Actions

30 May 2026

No Dividend history available

No Splits history available

No Bonus history available

No Rights history available
Quality key factors
Valuation key factors
Technicals key factors
 Technical Indicator Scale: Bearish, Mildly Bearish, Sideways, Mildly Bullish, Bullish Turned
 Shareholding Snapshot : Mar 2026
Shareholding Compare (%holding)
Non Institution
None
Held by 0 Schemes
Held by 0 FIIs
Ram Prasad Agarwala (7.77%)
Mudhra Fine Blanc Private Limited (11.21%)
28.17%
Quarterly Results Snapshot (Standalone) - Dec'25 - QoQ

QoQ Growth in quarter ended Dec 2025 is 8.12% vs -17.88% in Sep 2025

QoQ Growth in quarter ended Dec 2025 is -16.36% vs -3.51% in Sep 2025
Half Yearly Results Snapshot (Standalone) - Sep'25
Growth in half year ended Sep 2025 is 14.43% vs 13.60% in Sep 2024
Growth in half year ended Sep 2025 is -13.85% vs 132.14% in Sep 2024
Nine Monthly Results Snapshot (Standalone) - Dec'25
YoY Growth in nine months ended Dec 2025 is 13.06% vs 15.56% in Dec 2024
YoY Growth in nine months ended Dec 2025 is -21.39% vs 107.22% in Dec 2024
Annual Results Snapshot (Standalone) - Mar'25
YoY Growth in year ended Mar 2025 is 18.34% vs 14.57% in Mar 2024
YoY Growth in year ended Mar 2025 is 136.89% vs -54.98% in Mar 2024
About Frontline Corporation Ltd

Company Coordinates


