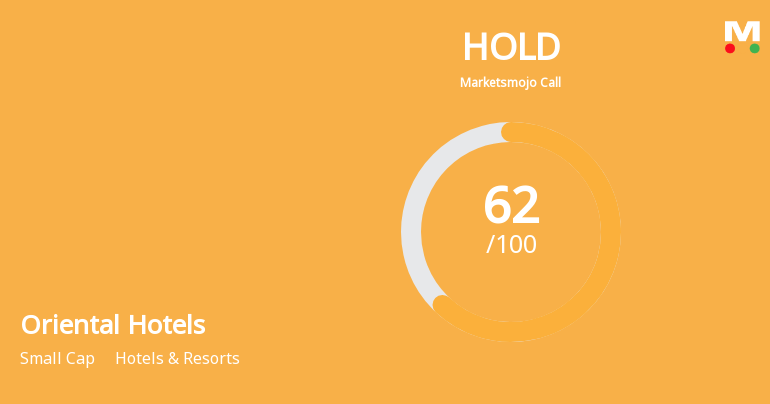
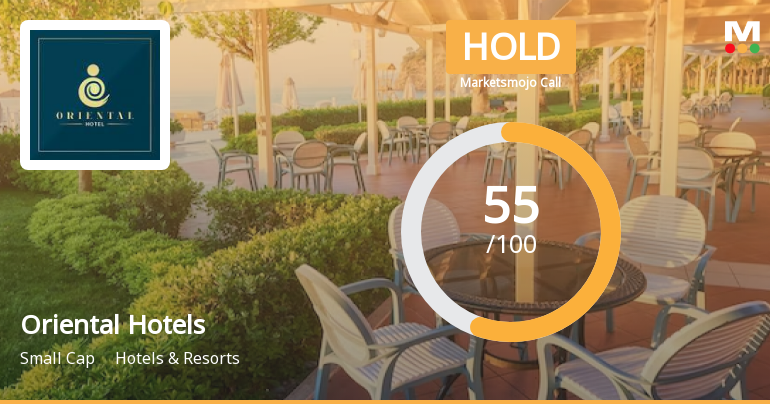
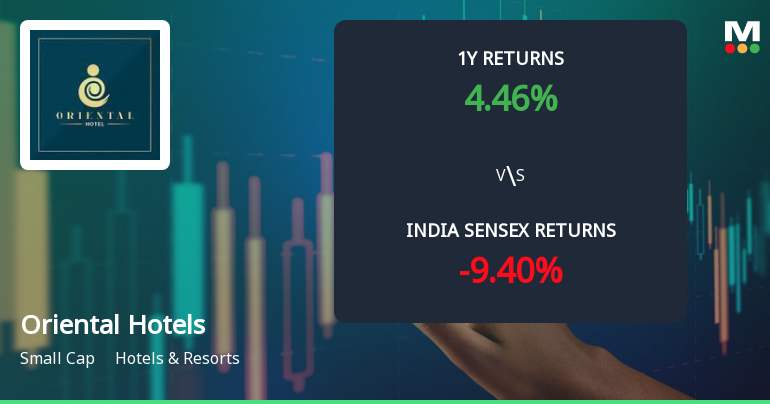
Oriental Hotels

  • Market Cap: Small Cap
  • Industry: Hotels & Resorts
  • ISIN: INE750A01020
  • NSEID: ORIENTHOT
  • BSEID: 500314
INR
138.50
17.05 (14.04%)
BSENSE

Aug 19, 12:21 PM

BSE+NSE Vol: 1.21 cr

  • Price Points
  • Score
  • Mojo Parameters
  • Total Return
  • News and Corporate Actions
  • Key factors
  • Shareholding
  • Financials
  • CompanyCV
stock-summaryPrice Point
High/Low

1Day

52 Week

Valuation
Technical
Day's Volume

CASH

1.21 cr (8,274.28%) Volume

Shareholding (Jun 2026)

FII

0.37%

Held by 19 FIIs

DII

1.14%

Held by 1 DIIs

Promoter

68.52%

Why is Oriental Hotels Ltd falling/rising?

19-Aug-2026

As of 18-Aug, Oriental Hotels Ltd's stock price is at 122.00, reflecting a decline of 0.49% and a total loss of 1.69% over the last two days. Despite strong long-term growth potential, recent performance and decreased investor participation indicate a bearish trend.

As of 18-Aug, Oriental Hotels Ltd's stock price is falling, currently at 122.00, which reflects a decrease of 0.6 or 0.49%. The stock has underperformed its sector by 0.37% today and has been on a consecutive decline for the last two days, accumulating a total loss of 1.69% during this period. Additionally, the stock's performance over the past week shows a significant decline of 4.87%, while its one-month performance is down by 3.60%. <BR><BR>Investor participation has also decreased, with the delivery volume on August 17 falling by 56.8% compared to the five-day average, indicating reduced trading interest. Although the stock is trading above its 100-day and 200-day moving averages, it is below the 5-day, 20-day, and 50-day moving averages, suggesting a short-term bearish trend. <BR><BR>Despite these negative indicators, the company shows potential for long-term growth, with net sales growing at an annual rate of 29.57% and operating profit at 31.68%. However, the recent performance and declining investor participation contribute to the current downward trend in the stock price.

View full answer

Who are in the management team of Oriental Hotels?

14-Aug-2026

The management team of Oriental Hotels includes Pramod Ranjan (Managing Director & CEO), Puneet Chhatwal (Chairman), and several directors, including D Vijayagopal Reddy, Ramesh D Hariani, and multiple independent directors such as Gita Nayyar and Vijay Sankar, bringing diverse expertise to the company.

The management team of Oriental Hotels includes the following key members:<BR><BR>1. **Pramod Ranjan** - Managing Director & CEO<BR>2. **Puneet Chhatwal** - Chairman (Non-Executive)<BR>3. **D Vijayagopal Reddy** - Director<BR>4. **Ramesh D Hariani** - Director<BR>5. **Gita Nayyar** - Independent Director<BR>6. **Vijay Sankar** - Independent Director<BR>7. **Phillie Dare Karkaria** - Independent Director<BR>8. **Giridhar Sanjeevi** - Director<BR>9. **Harish Lakshman** - Independent Director<BR>10. **Nina Chatrath** - Independent Director<BR><BR>This team brings a diverse range of expertise and leadership to the company.

View full answer

What does Oriental Hotels do?

14-Aug-2026

Oriental Hotels Ltd owns and manages hotels and resorts, primarily operating in the hospitality sector. As of June 2026, it reported net sales of 111 Cr and a net profit of 5 Cr, with a market cap of INR 2,259 Cr.

Overview: <BR>Oriental Hotels Ltd is engaged in the business of owning and managing hotels and resorts, operating within the Hotels & Resorts industry and classified as a Small Cap company.<BR><BR>History: <BR>Oriental Hotels Limited was incorporated in 1970, with its first hospitality project being the Taj Coromandel. The company has established itself as a reliable and steadily growing hotel operator. The latest reported financial results are for the quarter ending June 2026, showing net sales and profit figures.<BR><BR>Financial Snapshot: <BR>Net Sales: 111 Cr (Quarterly Results - Jun 2026) <BR>Net Profit: 5 Cr (Quarterly Results - Jun 2026) <BR>Market Cap: INR 2,259 Cr (Small Cap)<BR><BR>Key Metrics: <BR>P/E: 33.00 <BR>Industry P/E: 36 <BR>Dividend Yield: 0.51% <BR>Debt-Equity: 0.15 <BR>Return on Equity: 8.99% <BR>Price to Book: 2.97<BR><BR>Contact Details: <BR>Address: Taj Coromandel Hotel, 37 Mahatma Gandhi Road Chennai Tamil Nadu : 600034 <BR>Tel: 91-44-66002827 <BR>Email: ohlshares.mad@tajhotels.com <BR>Website: http://www.orienthot.co.in

View full answer

Who are the peers of the Oriental Hotels?

14-Aug-2026

Peers of Oriental Hotels include Mahindra Holiday, Juniper Hotels, Samhi Hotels, and others. Management risk varies from excellent at TajGVK Hotels to below average at Oriental Hotels, with a 1-year return of -11.06%, better than Mahindra Holiday but worse than Benares Hotels.

Peers: The peers of Oriental Hotels are Mahindra Holiday, Juniper Hotels, Samhi Hotels, Apeejay Surrend., Brigade Hotel, TajGVK Hotels, EIH Assoc.Hotels, Benares Hotels, and Asian Hotels (N).<BR><BR>Quality Snapshot: Excellent management risk is observed at TajGVK Hotels, EIH Assoc.Hotels, and Benares Hotels, while Average management risk is found at Mahindra Holiday, Juniper Hotels, Apeejay Surrend., Brigade Hotel, and Asian Hotels (N), and the rest. Below Average management risk is noted at Samhi Hotels, Oriental Hotels, and Mac Charles(I). Growth is Excellent at TajGVK Hotels and Benares Hotels, Good at Mahindra Holiday, Samhi Hotels, Oriental Hotels, EIH Assoc.Hotels, and Asian Hotels (N), while Average growth is seen at Brigade Hotel and the rest, and Below Average growth is present at Juniper Hotels and Apeejay Surrend. Capital Structure is Excellent at TajGVK Hotels and Benares Hotels, Good at Apeejay Surrend. and Brigade Hotel, Average at Oriental Hotels, and Below Average at Mahindra Holiday, Juniper Hotels, Samhi Hotels, and Asian Hotels (N).<BR><BR>Return Snapshot: Benares Hotels has the highest 1-year return at 10.05%, while Mahindra Holiday has the lowest at -37.49%. Oriental Hotels' 1-year return of -11.06% is better than Mahindra Holiday's but worse than Benares Hotels'. Additionally, peers with negative six-month returns include Mahindra Holiday, Juniper Hotels, Brigade Hotel, TajGVK Hotels, EIH Assoc.Hotels, and Asian Hotels (N).

View full answer

How big is Oriental Hotels?

14-Aug-2026

As of 14th August, Oriental Hotels Ltd has a market capitalization of 2,223.56 Cr and reported net sales of 497.67 Cr and net profit of 66.61 Cr over the latest four quarters.

As of 14th August, <BR><BR>Market Cap: Oriental Hotels Ltd has a market capitalization of 2,223.56 Cr, classified as Small Cap.<BR><BR>Recent Quarterly Performance: The sum of Net Sales for the latest 4 quarters is 497.67 Cr, while the sum of Net Profit for the same period is 66.61 Cr.<BR><BR>Balance Sheet Snapshot: The reporting period is March 2026, with Shareholder's Funds amounting to 762.06 Cr and Total Assets valued at 975.01 Cr.

View full answer

Are Oriental Hotels Ltd latest results good or bad?

16-Jul-2026

The latest results for Oriental Hotels Ltd are concerning, showing a 3.56% increase in net sales but a 20.06% decline in net profit, with profit margins significantly reduced due to rising operational costs. Overall, these results indicate challenges in maintaining profitability despite stable revenues.

The latest results for Oriental Hotels Ltd indicate a challenging performance. While the company reported a modest year-on-year increase in net sales of 3.56%, this growth was overshadowed by a significant decline in profitability. The consolidated net profit fell by 20.06% compared to the same quarter last year, and the profit after tax margin nearly halved to 8.52%. <BR><BR>Additionally, the operating profit margin contracted to 21.03%, down from 23.81% in the previous year, reflecting rising operational costs that the company struggled to manage. The sequential performance was particularly concerning, with revenues declining by 18.31% quarter-on-quarter and profits collapsing by over 80%. <BR><BR>Overall, these results highlight persistent operational headwinds and suggest that the company is facing significant challenges in maintaining profitability despite a stable revenue base. Therefore, the latest results can be characterized as bad, raising concerns about cost management and pricing power in a competitive hospitality landscape.

View full answer

Should I buy, sell or hold Oriental Hotels Ltd?

16-Jul-2026

When is the next results date for Oriental Hotels Ltd?

10-Jul-2026

The next results date for Oriental Hotels Ltd is 15 July 2026.

The next results date for Oriental Hotels Ltd is scheduled for 15 July 2026.

View full answer

Is Oriental Hotels overvalued or undervalued?

21-Oct-2025

As of October 20, 2025, Oriental Hotels is considered very attractive and undervalued compared to peers, with a PE ratio of 45.41 and a favorable EV to EBITDA of 25.53, despite a year-to-date return of -27.45%, while maintaining a strong long-term outlook with a 5-year return of 531.66%.

As of 20 October 2025, the valuation grade for Oriental Hotels has moved from attractive to very attractive, indicating a significant improvement in its perceived value. The company is currently considered undervalued, particularly when compared to its peers in the hotel and resort industry. Key ratios include a PE ratio of 45.41, an EV to EBITDA of 25.53, and a Price to Book Value of 0.32, which suggest that despite a high PE ratio, the overall valuation remains favorable relative to its book value.<BR><BR>In comparison to peers, Oriental Hotels has a PE ratio of 45.41, while Indian Hotels Co has a much higher PE of 62.08, and ITC Hotels stands at 65.5, both categorized as very expensive. Additionally, the EV to EBITDA ratio for Oriental Hotels is lower than that of Indian Hotels Co at 36.54 and ITC Hotels at 37.26, reinforcing its undervaluation. Despite recent stock performance lagging behind the Sensex, particularly with a year-to-date return of -27.45% compared to the Sensex's 7.97%, the long-term outlook remains strong with a 5-year return of 531.66%.

View full answer

How has been the historical performance of Oriental Hotels?

17-Oct-2025

Oriental Hotels has shown growth in net sales and operating income, reaching 439.70 Cr in March 2025, but profitability metrics, including profit after tax and consolidated net profit, have declined due to rising operational costs. Total assets and liabilities increased, indicating a stable financial position despite challenges in maintaining net profit levels.

Answer:<BR>The historical performance of Oriental Hotels shows a fluctuating trend in key financial metrics over the years, with notable improvements in recent periods.<BR><BR>Breakdown:<BR>Oriental Hotels reported net sales of 439.70 Cr for the year ending March 2025, an increase from 393.16 Cr in March 2024 and 394.51 Cr in March 2023, indicating a recovery from lower sales figures in previous years. The total operating income also rose to 439.70 Cr in March 2025 from 393.16 Cr in the prior year. Total expenditure, excluding depreciation, increased to 329.60 Cr in March 2025 from 295.34 Cr in March 2024, reflecting rising operational costs. Operating profit (PBDIT) for March 2025 was reported at 113.30 Cr, slightly down from 123.08 Cr in March 2023, while profit before tax decreased to 63.16 Cr from 67.80 Cr in March 2024. The profit after tax for March 2025 was 42.24 Cr, down from 50.07 Cr in the previous year. The consolidated net profit also fell to 39.21 Cr from 49.65 Cr in March 2024. On the balance sheet, total assets increased to 942.40 Cr in March 2025 from 869.67 Cr in March 2024, while total liabilities rose to 942.40 Cr from 869.67 Cr, indicating a stable financial position despite the increase in debt levels. Cash flow from operating activities improved to 99.00 Cr in March 2025 from 90.00 Cr in March 2024, although the net cash outflow was recorded at -2.00 Cr, a slight improvement from -6.00 Cr in the previous year. Overall, while Oriental Hotels has shown growth in sales and operating income, profitability metrics have seen a decline, reflecting challenges in maintaining net profit levels amidst rising costs.

View full answer

Is Oriental Hotels technically bullish or bearish?

15-Sep-2025

As of September 12, 2025, the market trend has shifted to a bearish stance with moderate strength, driven by bearish indicators such as the MACD and moving averages, despite some mildly bullish signals from Dow Theory.

As of 12 September 2025, the technical trend has changed from mildly bearish to bearish. The current stance is bearish with a moderate strength. Key indicators driving this include a bearish MACD on the weekly chart, bearish moving averages on the daily chart, and a bearish KST on the weekly chart. While the Dow Theory shows mildly bullish signals on the weekly timeframe, the overall monthly indicators, including the MACD and Bollinger Bands, remain bearish, reinforcing the negative outlook.

View full answer

Who are the top shareholders of the Oriental Hotels?

17-Jul-2025

The top shareholder of Oriental Hotels is the Indian Hotels Company Limited, owning 28.54%. Other notable shareholders include Quant Mutual Fund at 2.68%, 26 Foreign Institutional Investors holding 0.43%, and individual investors with a collective stake of 21.59%.

The top shareholders of Oriental Hotels include the Indian Hotels Company Limited, which holds the largest stake at 28.54%. Other significant shareholders are mutual funds, with Quant Mutual Fund - Quant Value Fund being the highest public shareholder at 2.68%. Additionally, there are 26 Foreign Institutional Investors (FIIs) holding 0.43% of the shares. Individual investors collectively own 21.59% of the company. It's worth noting that the promoter holdings are primarily held by the promoters, with a small portion (0.1262%) pledged.

View full answer

Has Oriental Hotels declared dividend?

06-Jun-2025

Yes, Oriental Hotels Ltd has declared a 50% dividend, amounting to 0.5 per share, with an ex-date of July 11, 2024. Despite recent volatility, the company has shown strong long-term growth in both price and dividends.

Oriental Hotels Ltd has declared a 50% dividend.<BR><BR>Dividend Details:<BR>- Percentage announced: 50%<BR>- Amount per share: 0.5<BR>- Ex-date: Jul-11-2024<BR><BR>Dividend Yield: 0.32%.<BR><BR>Total Returns by Period:<BR>In the last 6 months, the price return was -20.49%, with a dividend return of 0%, resulting in a total return of -20.49%.<BR><BR>Over the past year, the price return was 14.98%, the dividend return was 0.36%, leading to a total return of 15.34%.<BR><BR>In the 2-year period, the price return stood at 78.54%, with a dividend return of 1.07%, culminating in a total return of 79.61%.<BR><BR>For the 3-year period, the price return was 171.17%, the dividend return was 1.85%, resulting in a total return of 173.02%.<BR><BR>In the last 4 years, the price return reached 276.9%, with a dividend return of 2.62%, leading to a total return of 279.52%.<BR><BR>Over the past 5 years, the price return was 537.88%, with a dividend return of 6.17%, resulting in a total return of 544.05%.<BR><BR>Overall, Oriental Hotels has declared a significant dividend, and while recent returns have shown volatility, the longer-term performance indicates strong growth in both price and dividends.

View full answer
iScoreScore
Click here to find our call on this stock
Strong Sell
Sell
Hold
Buy
Strong Buy

Dashboard

1

Poor Management Efficiency with a low ROCE of 8.39%

  • The company has been able to generate a Return on Capital Employed (avg) of 8.39% signifying low profitability per unit of total capital (equity and debt)
2

Healthy long term growth as Net Sales has grown by an annual rate of 29.57% and Operating profit at 31.68%

 
3

Flat results in Jun 26

4

With ROCE of 11.2, it has a Attractive valuation with a 2.6 Enterprise value to Capital Employed

5

Majority shareholders : Promoters

 
stock-summaryMojo Parameters

Mojo Parameters

Loading Valuation Snapshot...

Stock DNA

stock-summary
Industry

Hotels & Resorts

stock-summary
Market cap

INR 2,474 Cr (Small Cap)

stock-summary
P/E

32.00

stock-summary
Industry P/E

36

stock-summary
Dividend Yield

0.53%

stock-summary
Debt Equity

0.15

stock-summary
Return on Equity

8.99%

stock-summary
Price to Book

2.86

Revenue and Profits:
Net Sales:
111 Cr
(Quarterly Results - Jun 2026)
Net Profit:
5 Cr
stock-summaryTotal Returns
Total Returns (Price + Dividend) stock-summary
Dividend Yield (0.53%)
TimePeriod
Price Return
Dividend Return
Total Return
3 Months
44.15%
0.67%
44.82%
6 Months
35.85%
0.65%
36.5%
1 Year
-0.47%
0.47%
0.0%
2 Years
3.67%
0.80%
4.47%
3 Years
65.45%
1.90%
67.35%
4 Years
107.96%
3.26%
111.22%
5 Years
281.54%
5.97%
287.51%

Latest dividend: 0.65 per share ex-dividend date: Jul-23-2026

Risk Adjusted Returns v/s stock-summary
Returns Beta
Icon
Beta has not been calculated since enough price history is not available
stock-summaryNews & Corporate Actions

News

Oriental Hotels Ltd Falls 2.93%: Mixed Technical Signals and Valuation Shifts Shape Weekly Trend

Announcements stock-summary

Disclosure Under Regulation 30 Of The SEBI (Listing Obligations And Disclosure Requirements) Regulations 2015 - ESG Rating

11-Aug-2026 | Source : BSE

Please find attached disclosure.

Announcement under Regulation 30 (LODR)-Newspaper Publication

03-Aug-2026 | Source : BSE

Please find attached disclosure.

Shareholder Meeting / Postal Ballot-Scrutinizers Report

31-Jul-2026 | Source : BSE

Please find attached the voting results along with the scrutiners report of the Annual General Meeting of the Company.

Corporate Actions stock-summary

stock-summary
BOARD MEETING

No Upcoming Board Meetings

stock-summary
DIVIDEND

Oriental Hotels Ltd has declared 65% dividend, ex-date: 23 Jul 26

stock-summary
SPLITS

Oriental Hotels Ltd has announced 1:10 stock split, ex-date: 10 Nov 10

stock-summary
BONUS

No Bonus history available

stock-summary
RIGHTS

No Rights history available

stock-summaryKey Factors

Quality key factors stock-summary

Factor
Value
Sales Growth (5y)
29.57%
EBIT Growth (5y)
31.68%
EBIT to Interest (avg)
4.57
Debt to EBITDA (avg)
Negative Net Debt
Net Debt to Equity (avg)
0.15
Sales to Capital Employed (avg)
0.46
Tax Ratio
21.10%
Dividend Payout Ratio
17.08%
Pledged Shares
0.12%
Institutional Holding
1.51%
ROCE (avg)
7.35%
ROE (avg)
6.57%

Valuation key factors

Factor
Value
P/E Ratio
32
Industry P/E
36
Price to Book Value
2.86
EV to EBIT
24.12
EV to EBITDA
17.63
EV to Capital Employed
2.61
EV to Sales
4.61
PEG Ratio
0.77
Dividend Yield
0.53%
ROCE (Latest)
11.15%
ROE (Latest)
8.99%

Technicals key factors

Indicator
Weekly
Monthly
MACD
Bullish
Mildly Bullish
RSI
Bearish
Bearish
Bollinger Bands
Mildly Bullish
Bearish
Moving Averages
Mildly Bullish (Daily)
KST
Bullish
Bearish
Dow Theory
Mildly Bearish
Mildly Bullish
OBV
No Trend
No Trend
stock-summary Technical Indicator Scale: Bearish, Mildly Bearish, Sideways, Mildly Bullish, Bullish  Turned 
stock-summaryShareholding
Shareholding Snapshot : Jun 2026stock-summary
Shareholding Compare (%holding) stock-summary
Majority shareholders

Promoters

Pledged Promoter Holdings

0.1245

Mutual Funds

Held by 2 Schemes (1.14%)

FIIs

Held by 19 FIIs (0.37%)

Promoter with highest holding

The Indian Hotels Company Limited (28.54%)

Highest Public shareholder

Quant Mutual Fund - Quant Small Cap Fund (1.14%)

Individual Investors Holdings

20.61%

stock-summaryFinancial
[
  {
    "link": "quarterly",
    "btn_text": "All Quarterly Results",
    "header": "Quarterly Results Snapshot (Consolidated) - Jun'26 - YoY",
    "rhs": [
      {
        "prefix": "Net Sales ",
        "suffix": "YoY Growth in quarter ended Jun 2026 is 3.56% vs 31.33% in Jun 2025",
        "dir": -1
      },
      {
        "prefix": "Consolidated Net Profit ",
        "suffix": "YoY Growth in quarter ended Jun 2026 is -20.06% vs 591.11% in Jun 2025",
        "dir": -1
      }
    ],
    "table": {
      "header": [
        "Jun'26",
        "Jun'25",
        "Change(%)"
      ],
      "body": [
        {
          "field": "Net Sales",
          "val1": "111.48",
          "val2": "107.65",
          "chgp": "3.56%",
          "chgp_class": "positive"
        },
        {
          "field": "Operating Profit (PBDIT) excl Other Income",
          "val1": "23.44",
          "val2": "25.63",
          "chgp": "-8.54%",
          "chgp_class": "negative"
        },
        {
          "field": "Interest",
          "val1": "2.49",
          "val2": "3.70",
          "chgp": "-32.70%",
          "chgp_class": "positive"
        },
        {
          "field": "Exceptional Items",
          "val1": "0.00",
          "val2": "0.00",
          "chgp": "",
          "chgp_class": "neutral"
        },
        {
          "field": "Consolidate Net Profit",
          "val1": "5.30",
          "val2": "6.63",
          "chgp": "-20.06%",
          "chgp_class": "negative"
        },
        {
          "field": "Operating Profit Margin (Excl OI)",
          "val1": "21.03%",
          "val2": "23.81%",
          "chgp": "-2.78%",
          "chgp_class": "negative"
        }
      ]
    }
  },
  {
    "link": "half-yearly",
    "btn_text": "All Half Yearly Results",
    "header": "Half Yearly Results Snapshot (Consolidated) - Sep'25",
    "rhs": [
      {
        "prefix": "Net Sales ",
        "suffix": " Growth in half year ended Sep 2025 is 17.74% vs 0.90% in Sep 2024",
        "dir": 1
      },
      {
        "prefix": "Consolidated Net Profit ",
        "suffix": " Growth in half year ended Sep 2025 is 234.63% vs -62.93% in Sep 2024",
        "dir": 1
      }
    ],
    "table": {
      "header": [
        "Sep'25",
        "Sep'24",
        "Change(%)"
      ],
      "body": [
        {
          "field": "Net Sales",
          "val1": "218.13",
          "val2": "185.27",
          "chgp": "17.74%",
          "chgp_class": "positive"
        },
        {
          "field": "Operating Profit (PBDIT) excl Other Income",
          "val1": "51.95",
          "val2": "36.49",
          "chgp": "42.37%",
          "chgp_class": "positive"
        },
        {
          "field": "Interest",
          "val1": "7.34",
          "val2": "8.20",
          "chgp": "-10.49%",
          "chgp_class": "positive"
        },
        {
          "field": "Exceptional Items",
          "val1": "0.00",
          "val2": "0.00",
          "chgp": "",
          "chgp_class": "neutral"
        },
        {
          "field": "Consolidate Net Profit",
          "val1": "14.59",
          "val2": "4.36",
          "chgp": "234.63%",
          "chgp_class": "positive"
        },
        {
          "field": "Operating Profit Margin (Excl OI)",
          "val1": "23.82%",
          "val2": "19.70%",
          "chgp": "4.12%",
          "chgp_class": "positive"
        }
      ]
    }
  },
  {
    "link": "nine-monthly",
    "btn_text": "All Nine Monthly Results",
    "header": "Nine Monthly Results Snapshot (Consolidated) - Dec'25",
    "rhs": [
      {
        "prefix": "Net Sales ",
        "suffix": "YoY Growth in nine months ended Dec 2025 is 16.35% vs 7.52% in Dec 2024",
        "dir": 1
      },
      {
        "prefix": "Consolidated Net Profit ",
        "suffix": "YoY Growth in nine months ended Dec 2025 is 79.44% vs -34.70% in Dec 2024",
        "dir": 1
      }
    ],
    "table": {
      "header": [
        "Dec'25",
        "Dec'24",
        "Change(%)"
      ],
      "body": [
        {
          "field": "Net Sales",
          "val1": "357.38",
          "val2": "307.17",
          "chgp": "16.35%",
          "chgp_class": "positive"
        },
        {
          "field": "Operating Profit (PBDIT) excl Other Income",
          "val1": "93.82",
          "val2": "71.07",
          "chgp": "32.01%",
          "chgp_class": "positive"
        },
        {
          "field": "Interest",
          "val1": "10.86",
          "val2": "12.76",
          "chgp": "-14.89%",
          "chgp_class": "positive"
        },
        {
          "field": "Exceptional Items",
          "val1": "-0.80",
          "val2": "0.00",
          "chgp": "",
          "chgp_class": "neutral"
        },
        {
          "field": "Consolidate Net Profit",
          "val1": "35.53",
          "val2": "19.80",
          "chgp": "79.44%",
          "chgp_class": "positive"
        },
        {
          "field": "Operating Profit Margin (Excl OI)",
          "val1": "26.25%",
          "val2": "23.14%",
          "chgp": "3.11%",
          "chgp_class": "positive"
        }
      ]
    }
  },
  {
    "link": "annual",
    "btn_text": "All Annual Results",
    "header": "Annual Results Snapshot (Consolidated) - Mar'26",
    "rhs": [
      {
        "prefix": "Net Sales ",
        "suffix": "YoY Growth in year ended Mar 2026 is 12.31% vs 11.84% in Mar 2025",
        "dir": 1
      },
      {
        "prefix": "Consolidated Net Profit ",
        "suffix": "YoY Growth in year ended Mar 2026 is 73.30% vs -21.03% in Mar 2025",
        "dir": 1
      }
    ],
    "table": {
      "header": [
        "Mar'26",
        "Mar'25",
        "Change(%)"
      ],
      "body": [
        {
          "field": "Net Sales",
          "val1": "493.84",
          "val2": "439.70",
          "chgp": "12.31%",
          "chgp_class": "positive"
        },
        {
          "field": "Operating Profit (PBDIT) excl Other Income",
          "val1": "132.37",
          "val2": "110.10",
          "chgp": "20.23%",
          "chgp_class": "positive"
        },
        {
          "field": "Interest",
          "val1": "13.60",
          "val2": "17.01",
          "chgp": "-20.05%",
          "chgp_class": "positive"
        },
        {
          "field": "Exceptional Items",
          "val1": "-0.80",
          "val2": "0.00",
          "chgp": "",
          "chgp_class": "neutral"
        },
        {
          "field": "Consolidate Net Profit",
          "val1": "67.95",
          "val2": "39.21",
          "chgp": "73.30%",
          "chgp_class": "positive"
        },
        {
          "field": "Operating Profit Margin (Excl OI)",
          "val1": "26.80%",
          "val2": "25.04%",
          "chgp": "1.76%",
          "chgp_class": "positive"
        }
      ]
    }
  }
]

Quarterly Results Snapshot (Consolidated) - Jun'26 - YoYstock-summary

Jun'26
Jun'25
Change(%)
Net Sales
111.48
107.65
3.56%
Operating Profit (PBDIT) excl Other Income
23.44
25.63
-8.54%
Interest
2.49
3.70
-32.70%
Exceptional Items
0.00
0.00
Consolidate Net Profit
5.30
6.63
-20.06%
Operating Profit Margin (Excl OI)
21.03%
23.81%
-2.78%
Values in Rs Cr.
Direction Arrows
Net Sales

YoY Growth in quarter ended Jun 2026 is 3.56% vs 31.33% in Jun 2025

Direction Arrows
Consolidated Net Profit

YoY Growth in quarter ended Jun 2026 is -20.06% vs 591.11% in Jun 2025

Half Yearly Results Snapshot (Consolidated) - Sep'25stock-summary

Sep'25
Sep'24
Change(%)
Net Sales
218.13
185.27
17.74%
Operating Profit (PBDIT) excl Other Income
51.95
36.49
42.37%
Interest
7.34
8.20
-10.49%
Exceptional Items
0.00
0.00
Consolidate Net Profit
14.59
4.36
234.63%
Operating Profit Margin (Excl OI)
23.82%
19.70%
4.12%
Values in Rs Cr.
Direction Arrows
Net Sales

Growth in half year ended Sep 2025 is 17.74% vs 0.90% in Sep 2024

Direction Arrows
Consolidated Net Profit

Growth in half year ended Sep 2025 is 234.63% vs -62.93% in Sep 2024

Nine Monthly Results Snapshot (Consolidated) - Dec'25stock-summary

Dec'25
Dec'24
Change(%)
Net Sales
357.38
307.17
16.35%
Operating Profit (PBDIT) excl Other Income
93.82
71.07
32.01%
Interest
10.86
12.76
-14.89%
Exceptional Items
-0.80
0.00
Consolidate Net Profit
35.53
19.80
79.44%
Operating Profit Margin (Excl OI)
26.25%
23.14%
3.11%
Values in Rs Cr.
Direction Arrows
Net Sales

YoY Growth in nine months ended Dec 2025 is 16.35% vs 7.52% in Dec 2024

Direction Arrows
Consolidated Net Profit

YoY Growth in nine months ended Dec 2025 is 79.44% vs -34.70% in Dec 2024

Annual Results Snapshot (Consolidated) - Mar'26stock-summary

Mar'26
Mar'25
Change(%)
Net Sales
493.84
439.70
12.31%
Operating Profit (PBDIT) excl Other Income
132.37
110.10
20.23%
Interest
13.60
17.01
-20.05%
Exceptional Items
-0.80
0.00
Consolidate Net Profit
67.95
39.21
73.30%
Operating Profit Margin (Excl OI)
26.80%
25.04%
1.76%
Values in Rs Cr.
Direction Arrows
Net Sales

YoY Growth in year ended Mar 2026 is 12.31% vs 11.84% in Mar 2025

Direction Arrows
Consolidated Net Profit

YoY Growth in year ended Mar 2026 is 73.30% vs -21.03% in Mar 2025

stock-summaryCompany CV
About Oriental Hotels Ltd stock-summary
stock-summary
Oriental Hotels Ltd
Small Cap
Hotels & Resorts
Oriental Hotels Limited (OHL) was incorporated in year 1970 to establish and run world class hotels. Taj Coromandel was the first hospitality project of OHL. OHL's hotels are marketed as part of the Taj Group of Hotels. Over a period of time, OHL has established itself as a very reliable and steadily growing Hotel Company and has expanded its operations significantly. Presently the Company is engaged in the business of owning & managing hotels and resorts.
Company Coordinates stock-summary
Company Details
Taj Coromandel Hotel, 37 Mahatma Gandhi Road Chennai Tamil Nadu : 600034
stock-summary
Tel: 91-44-66002827
stock-summary
ohlshares.mad@tajhotels.com
Registrar Details
Integrated Enterprises (India) Ltd , II Floor , Kences Towers, No 1 Ramakrishna Street, North Usman Road, T Nagar, Chennai