
Compare Nilkamal Ltd with Similar Stocks
Stock DNA
Diversified consumer products
INR 1,969 Cr (Small Cap)
15.00
34
1.59%
0.20
8.08%
1.19
Total Returns (Price + Dividend) 
Latest dividend: 20 per share ex-dividend date: Jul-11-2025
Risk Adjusted Returns v/s
Returns Beta

News
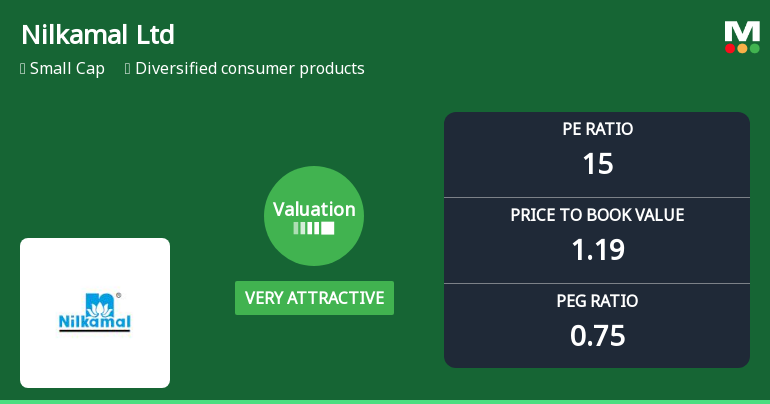
Nilkamal Ltd Valuation Turns Very Attractive Amidst Challenging Market Returns
Nilkamal Ltd, a key player in the diversified consumer products sector, has witnessed a notable shift in its valuation parameters, moving from an attractive to a very attractive rating. This change reflects a significant reassessment of its price-to-earnings (P/E) and price-to-book value (P/BV) ratios relative to historical averages and peer benchmarks, offering investors a fresh perspective on its price attractiveness amid a challenging market backdrop.
Read full news article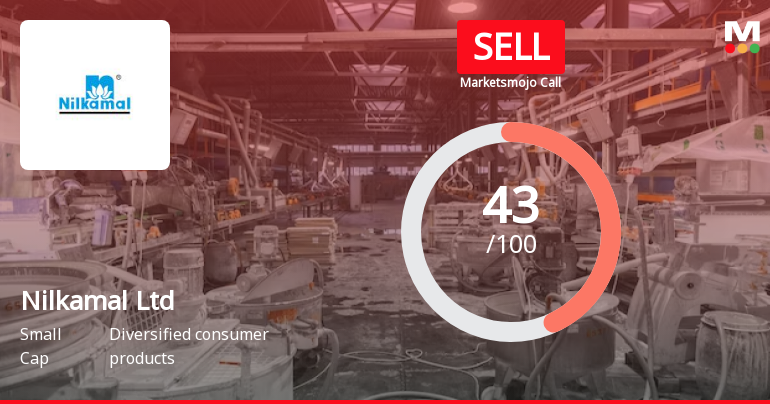
Nilkamal Ltd is Rated Sell by MarketsMOJO
Nilkamal Ltd is rated 'Sell' by MarketsMOJO, with this rating last updated on 15 Apr 2025. However, the analysis and financial metrics discussed here reflect the company’s current position as of 25 June 2026, providing investors with an up-to-date perspective on the stock’s fundamentals, valuation, financial trend, and technical outlook.
Read full news article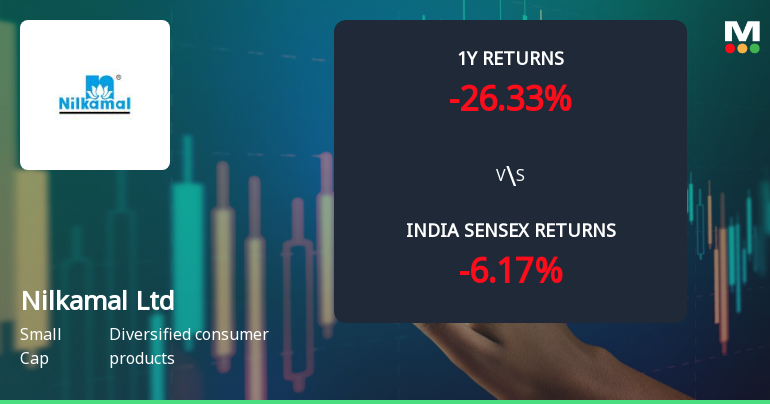
Nilkamal Ltd Technical Momentum Shifts Amid Bearish Signals
Nilkamal Ltd, a small-cap player in the diversified consumer products sector, has experienced a notable shift in its technical momentum, moving from a mildly bearish stance to a more pronounced bearish trend. Recent technical indicators, including MACD, RSI, Bollinger Bands, and moving averages, reveal a complex picture of weakening price momentum amid broader market challenges.
Read full news article Announcements
Closure of Trading Window
26-Jun-2026 | Source : BSEIntimation of Closure of Trading Window.
Announcement under Regulation 30 (LODR)-Newspaper Publication
23-Jun-2026 | Source : BSENewspaper advertisement for 40th Annual General Meeting to be held on July 17 2026.
Notice Of The 40Th Annual General Meeting Of The Company.
22-Jun-2026 | Source : BSENotice of the 40th Annual General Meeting of the Company.
Corporate Actions

No Upcoming Board Meetings

Nilkamal Ltd has declared 200% dividend, ex-date: 10 Jul 26

No Splits history available

No Bonus history available

No Rights history available
Quality key factors
Valuation key factors
Technicals key factors
 Technical Indicator Scale: Bearish, Mildly Bearish, Sideways, Mildly Bullish, Bullish Turned
 Shareholding Snapshot : Mar 2026
Shareholding Compare (%holding)
Promoters
None
Held by 4 Schemes (13.72%)
Held by 37 FIIs (0.98%)
Nayan S. Parekh (14.76%)
Dsp Small Cap Fund (7.9%)
17.41%
Quarterly Results Snapshot (Consolidated) - Mar'26 - YoY

YoY Growth in quarter ended Mar 2026 is 7.96% vs 7.17% in Mar 2025
YoY Growth in quarter ended Mar 2026 is 21.65% vs -3.89% in Mar 2025
Half Yearly Results Snapshot (Consolidated) - Sep'25
Growth in half year ended Sep 2025 is 18.31% vs 0.37% in Sep 2024
Growth in half year ended Sep 2025 is -3.94% vs -11.54% in Sep 2024
Nine Monthly Results Snapshot (Consolidated) - Dec'25
YoY Growth in nine months ended Dec 2025 is 16.30% vs 2.40% in Dec 2024
YoY Growth in nine months ended Dec 2025 is 2.45% vs -16.65% in Dec 2024
Annual Results Snapshot (Consolidated) - Mar'26
YoY Growth in year ended Mar 2026 is 14.05% vs 3.64% in Mar 2025
YoY Growth in year ended Mar 2026 is 8.60% vs -12.94% in Mar 2025
About Nilkamal Ltd

Company Coordinates


