
Compare Gravita India with Similar Stocks
Dashboard
Strong Long Term Fundamental Strength with an average Return on Equity (ROE) of 25.86%
- Healthy long term growth as Operating profit has grown by an annual rate 34.02%
- Strong ability to service debt as the company has a low Debt to EBITDA ratio of 1.69 times
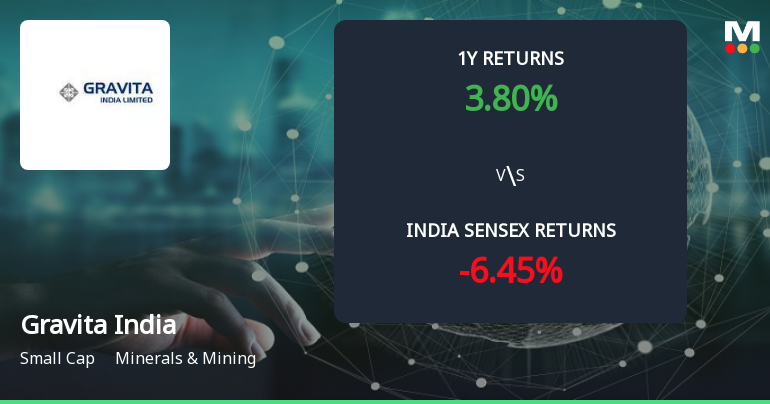
Consistent Returns over the last 3 years
Stock DNA
Minerals & Mining
INR 13,101 Cr (Small Cap)
34.00
15
0.00%
0.06
15.45%
5.20
Total Returns (Price + Dividend) 
Latest dividend: 6.34 per share ex-dividend date: May-08-2025
Risk Adjusted Returns v/s
Returns Beta

News
Golden Cross Confirmed: Do Gravita India Ltd's Other Technical Indicators Agree?
The 50-day moving average has crossed above the 200-day moving average for Gravita India Ltd on 22 Jun 2026, signalling a golden cross. Yet, the broader technical picture presents a nuanced view, with weekly indicators mostly bullish but monthly momentum showing mild bearishness. This divergence invites a closer look at whether the golden cross stands as a reliable signal or is contradicted by other data.
Read full news article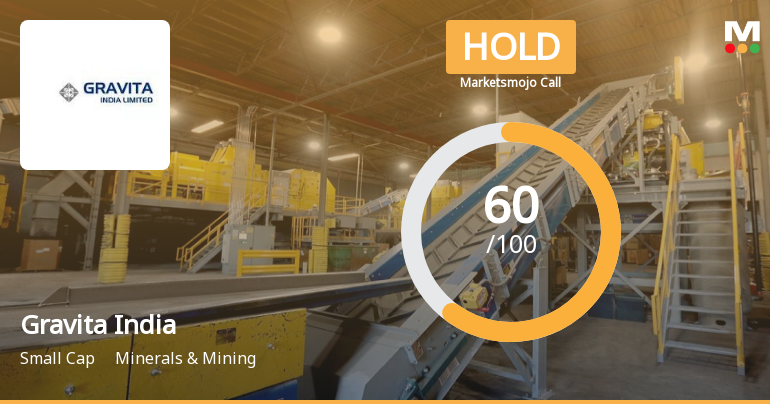
Gravita India Ltd is Rated Hold
Gravita India Ltd is rated Hold by MarketsMOJO, with this rating last updated on 07 May 2026. While the rating change occurred on that date, the analysis and financial metrics discussed here reflect the company’s current position as of 19 June 2026, providing investors with the most up-to-date view of the stock’s fundamentals, returns, and technical outlook.
Read full news article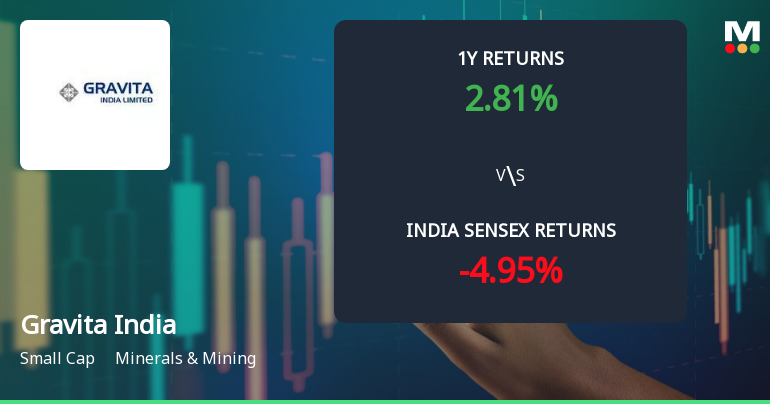
Gravita India Ltd Technical Momentum Shifts Amid Mixed Indicator Signals
Gravita India Ltd has experienced a notable shift in its technical momentum, moving from a mildly bearish stance to a sideways trend, reflecting a complex interplay of bullish and bearish signals across key technical indicators. The stock’s recent price action, combined with mixed readings from MACD, RSI, moving averages, and other momentum oscillators, suggests a period of consolidation with potential directional cues emerging in the near term.
Read full news article Announcements
Announcement under Regulation 30 (LODR)-Credit Rating
19-Jun-2026 | Source : BSEIntimation of Credit Rating under Regulation 30 of SEBI (LODR) Regulations 2015.
Announcement under Regulation 30 (LODR)-Analyst / Investor Meet - Intimation
19-Jun-2026 | Source : BSEPursuant to Regulation 30 of Securities and Exchange Board of India (Listing Obligations and Disclosure Requirements) Regulations 2015 we hereby disclose the schedule of Analyst/ Institutional Investor meetings with the company.
Announcement under Regulation 30 (LODR)-Analyst / Investor Meet - Outcome
19-Jun-2026 | Source : BSEThis is further to the disclosure dated 15th June 2026 and 16th June 2026 made by the Company. We wish to inform you that the Companys executives participated in the Institutional Investors Meetings (One on One) dated 19th June 2026.
Corporate Actions

No Upcoming Board Meetings

Gravita India Ltd has declared 317% dividend, ex-date: 08 May 25

Gravita India Ltd has announced 2:10 stock split, ex-date: 25 May 12

No Bonus history available

No Rights history available
Quality key factors
Valuation key factors
Technicals key factors
 Technical Indicator Scale: Bearish, Mildly Bearish, Sideways, Mildly Bullish, Bullish Turned
 Shareholding Snapshot : Mar 2026
Shareholding Compare (%holding)
Promoters
None
Held by 21 Schemes (2.86%)
Held by 127 FIIs (13.94%)
Rajat Agrawal (32.38%)
Goldman Sachs Funds - Goldman Sachs India Equity P (2.23%)
18.16%
Quarterly Results Snapshot (Consolidated) - Mar'26 - QoQ

QoQ Growth in quarter ended Mar 2026 is 15.31% vs -1.78% in Dec 2025

QoQ Growth in quarter ended Mar 2026 is -5.93% vs 1.75% in Dec 2025
Half Yearly Results Snapshot (Consolidated) - Sep'25
Growth in half year ended Sep 2025 is 13.09% vs 19.21% in Sep 2024
Growth in half year ended Sep 2025 is 35.82% vs 26.74% in Sep 2024
Nine Monthly Results Snapshot (Consolidated) - Dec'25
YoY Growth in nine months ended Dec 2025 is 9.21% vs 23.26% in Dec 2024
YoY Growth in nine months ended Dec 2025 is 32.06% vs 27.65% in Dec 2024
Annual Results Snapshot (Consolidated) - Mar'26
YoY Growth in year ended Mar 2026 is 10.25% vs 22.40% in Mar 2025
YoY Growth in year ended Mar 2026 is 21.26% vs 30.60% in Mar 2025
About Gravita India Ltd

Company Coordinates


