
Compare Gravita India with Similar Stocks
Dashboard
Strong Long Term Fundamental Strength with an average Return on Equity (ROE) of 25.86%
- Healthy long term growth as Operating profit has grown by an annual rate 34.02%
- Strong ability to service debt as the company has a low Debt to EBITDA ratio of 1.69 times
With ROE of 15.5, it has a Fair valuation with a 5.2 Price to Book Value
Stock DNA
Minerals & Mining
INR 12,599 Cr (Small Cap)
32.00
14
0.00%
0.06
15.45%
5.15
Total Returns (Price + Dividend) 
Latest dividend: 6.34 per share ex-dividend date: May-08-2025
Risk Adjusted Returns v/s
Returns Beta

News
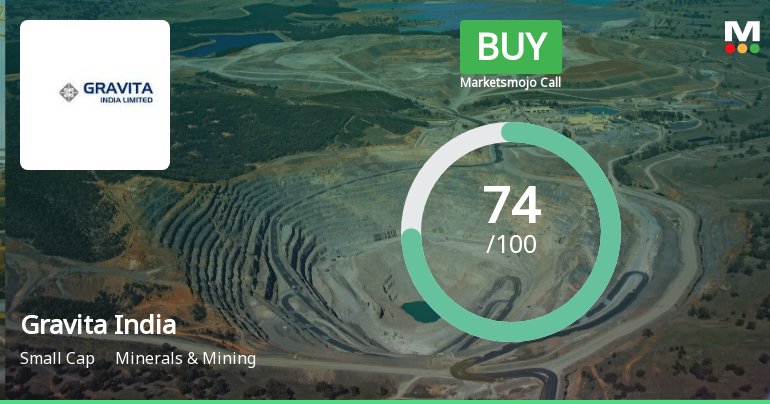
Gravita India Ltd Upgraded to Buy by MarketsMOJO on Strong Technical and Fundamental Grounds
Gravita India Ltd has seen its investment rating upgraded from Hold to Buy, reflecting a notable improvement in its technical outlook alongside robust long-term fundamentals. The upgrade, effective from 22 June 2026, is driven by a combination of bullish technical indicators, a strong financial trend, and a valuation shift that signals growing investor confidence despite a premium price. This comprehensive analysis explores the four key parameters that influenced the rating change: Quality, Valuation, Financial Trend, and Technicals.
Read full news article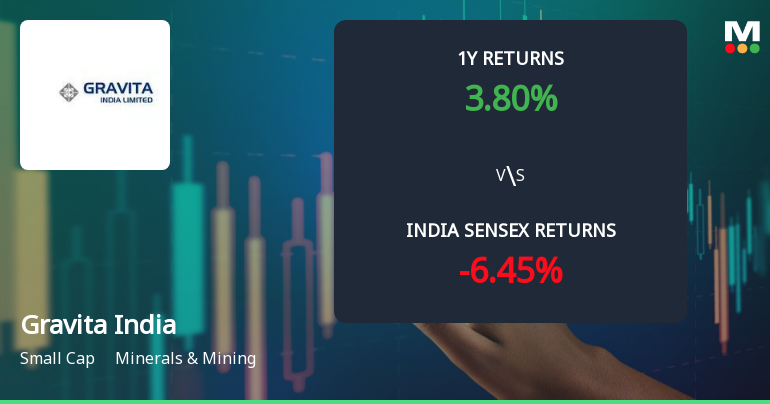
Gravita India Ltd Technical Momentum Shifts Signal Bullish Outlook
Gravita India Ltd has demonstrated a notable shift in its technical momentum, transitioning from a sideways trend to a bullish stance, supported by a confluence of positive signals across key indicators such as MACD, moving averages, and Bollinger Bands. This technical evolution, coupled with strong relative returns against the Sensex, underpins an upgraded investment grade and renewed investor interest in this small-cap minerals and mining company.
Read full news article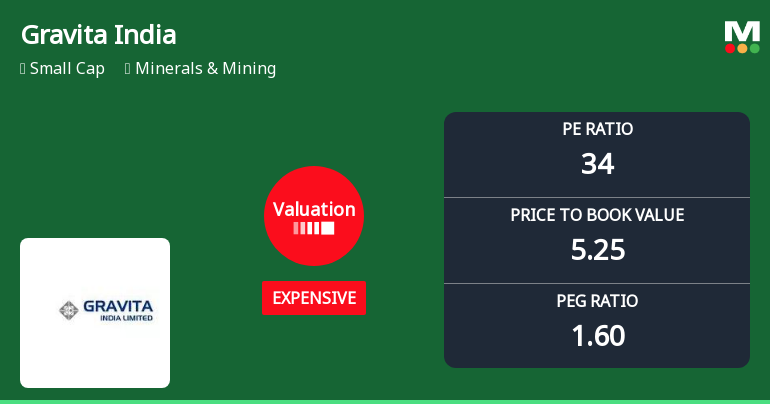
Gravita India Ltd Valuation Shifts Signal Price Attractiveness Change Amid Sector Dynamics
Gravita India Ltd, a prominent player in the Minerals & Mining sector, has seen a notable shift in its valuation parameters, moving from fair to expensive territory. This change, reflected in key metrics such as the price-to-earnings (P/E) and price-to-book value (P/BV) ratios, invites a closer examination of the stock’s price attractiveness relative to its historical averages and peer group.
Read full news article Announcements
Announcement under Regulation 30 (LODR)-Analyst / Investor Meet - Outcome
23-Jun-2026 | Source : BSEThis is further to the disclosure dated 18th June 2026 made by the Company. We wish to inform you that the Companys executives participated in the Institutional Investors Meeting (One on One) dated 23rd June 2026.
Announcement under Regulation 30 (LODR)-Newspaper Publication
23-Jun-2026 | Source : BSENewspaper advertisement for transfer of equity shares into IEPF account
Announcement under Regulation 30 (LODR)-Analyst / Investor Meet - Outcome
22-Jun-2026 | Source : BSEThis is further to the disclosure dated 16th June 2026 made by the Company. We wish to inform you that the Companys executives participated in the Institutional Investors Meeting (One on One) dated 22nd June 2026.
Corporate Actions

No Upcoming Board Meetings

Gravita India Ltd has declared 317% dividend, ex-date: 08 May 25

Gravita India Ltd has announced 2:10 stock split, ex-date: 25 May 12

No Bonus history available

No Rights history available
Quality key factors
Valuation key factors
Technicals key factors
 Technical Indicator Scale: Bearish, Mildly Bearish, Sideways, Mildly Bullish, Bullish Turned
 Shareholding Snapshot : Mar 2026
Shareholding Compare (%holding)
Promoters
None
Held by 21 Schemes (2.86%)
Held by 127 FIIs (13.94%)
Rajat Agrawal (32.38%)
Goldman Sachs Funds - Goldman Sachs India Equity P (2.23%)
18.16%
Quarterly Results Snapshot (Consolidated) - Mar'26 - QoQ

QoQ Growth in quarter ended Mar 2026 is 15.31% vs -1.78% in Dec 2025

QoQ Growth in quarter ended Mar 2026 is -5.93% vs 1.75% in Dec 2025
Half Yearly Results Snapshot (Consolidated) - Sep'25
Growth in half year ended Sep 2025 is 13.09% vs 19.21% in Sep 2024
Growth in half year ended Sep 2025 is 35.82% vs 26.74% in Sep 2024
Nine Monthly Results Snapshot (Consolidated) - Dec'25
YoY Growth in nine months ended Dec 2025 is 9.21% vs 23.26% in Dec 2024
YoY Growth in nine months ended Dec 2025 is 32.06% vs 27.65% in Dec 2024
Annual Results Snapshot (Consolidated) - Mar'26
YoY Growth in year ended Mar 2026 is 10.25% vs 22.40% in Mar 2025
YoY Growth in year ended Mar 2026 is 21.26% vs 30.60% in Mar 2025
About Gravita India Ltd

Company Coordinates


