
Compare Intense Tech. with Similar Stocks
Stock DNA
Software Products
INR 208 Cr (Micro Cap)
12.00
21
1.14%
-0.43
12.78%
1.66
Total Returns (Price + Dividend) 
Latest dividend: 1 per share ex-dividend date: Sep-23-2025
Risk Adjusted Returns v/s
Returns Beta

News
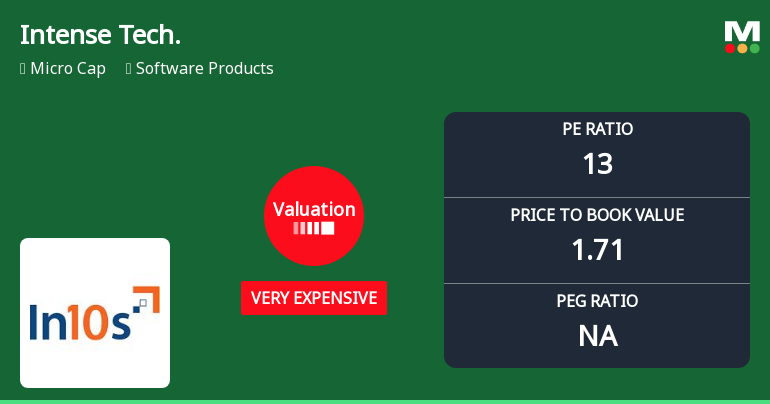
Intense Technologies Ltd Valuation Shifts Signal Elevated Price Risk
Intense Technologies Ltd, a micro-cap player in the Software Products sector, has seen its valuation parameters shift notably, with its price-to-earnings (P/E) ratio moving to 13.36 and price-to-book value (P/BV) at 1.71, marking a transition from expensive to very expensive territory. Despite this, the stock’s recent returns have been mixed, underperforming the Sensex over most short- and medium-term periods, raising questions about its price attractiveness relative to peers and historical benchmarks.
Read full news article
Intense Technologies Ltd is Rated Sell
Intense Technologies Ltd is rated Sell by MarketsMOJO. This rating was last updated on 22 June 2026, reflecting a shift from the previous Hold rating. However, the analysis and financial metrics discussed below are based on the stock’s current position as of 26 July 2026, providing investors with the most up-to-date view of the company’s fundamentals and market performance.
Read full news article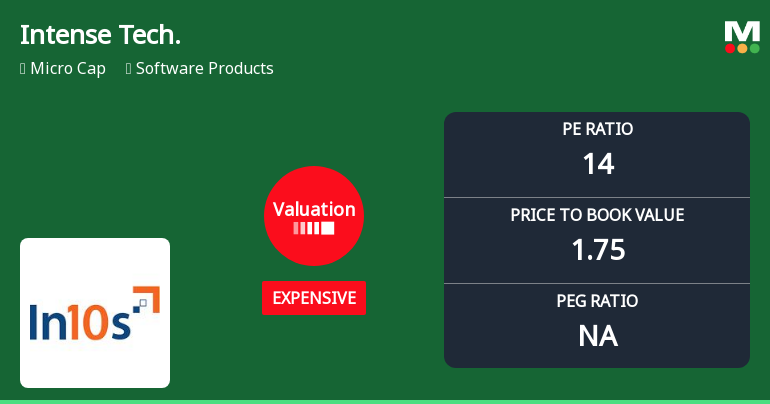
Intense Technologies Ltd Valuation Shifts Amid Market Pressure
Intense Technologies Ltd, a micro-cap player in the Software Products sector, has recently undergone a notable shift in its valuation parameters, prompting a downgrade in its Mojo Grade from Hold to Sell. This article analyses the evolving price attractiveness of the stock, examining key valuation metrics such as the price-to-earnings (P/E) ratio and price-to-book value (P/BV), while benchmarking against peers and historical averages to provide investors with a comprehensive perspective.
Read full news article Announcements
Compliances-Certificate under Reg. 74 (5) of SEBI (DP) Regulations 2018
06-Jul-2026 | Source : BSEPlease find enclosed the certificate under Reg 74(5) of SEBI (DP) Regulations issued by RTA
Closure of Trading Window
29-Jun-2026 | Source : BSEThis is to inform that the trading window for dealing in equity shares of the company by designated persons along with their immediate relatives will be closed from July 1st 2026 till 48 hours after declaration of un-audited Financial Results for the quarter ended June 30 2026
Announcement under Regulation 30 (LODR)-Resignation of Managing Director
19-Jun-2026 | Source : BSEPlease find enclosed the Resignation letter received from Mr. C.K. Shastri Founder and Managing director of the company citing his age and health factors with effect from closing of business hours of June 19th 2026.
Corporate Actions

No Upcoming Board Meetings

Intense Technologies Ltd has declared 50% dividend, ex-date: 23 Sep 25

No Splits history available

No Bonus history available

No Rights history available
Quality key factors
Valuation key factors
Technicals key factors
 Technical Indicator Scale: Bearish, Mildly Bearish, Sideways, Mildly Bullish, Bullish Turned
 Shareholding Snapshot : Jun 2026
Shareholding Compare (%holding)
Non Institution
None
Held by 0 Schemes
Held by 2 FIIs (6.87%)
C K Shastri (3.7%)
Yudiz Solutions Limited (10.52%)
58.8%
Quarterly Results Snapshot (Consolidated) - Mar'26 - QoQ

QoQ Growth in quarter ended Mar 2026 is -15.53% vs -0.54% in Dec 2025
QoQ Growth in quarter ended Mar 2026 is -1,065.09% vs -26.81% in Dec 2025
Half Yearly Results Snapshot (Consolidated) - Sep'25
Growth in half year ended Sep 2025 is -21.19% vs 44.48% in Sep 2024
Growth in half year ended Sep 2025 is -57.98% vs 26.29% in Sep 2024
Nine Monthly Results Snapshot (Consolidated) - Dec'25
YoY Growth in nine months ended Dec 2025 is -15.00% vs 37.34% in Dec 2024
YoY Growth in nine months ended Dec 2025 is -50.48% vs 7.76% in Dec 2024
Annual Results Snapshot (Consolidated) - Mar'26
YoY Growth in year ended Mar 2026 is -16.27% vs 30.84% in Mar 2025
YoY Growth in year ended Mar 2026 is -195.89% vs 4.35% in Mar 2025
About Intense Technologies Ltd

Company Coordinates


