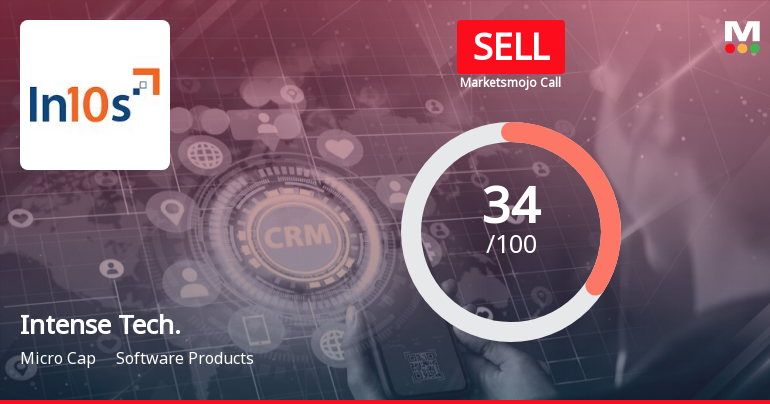
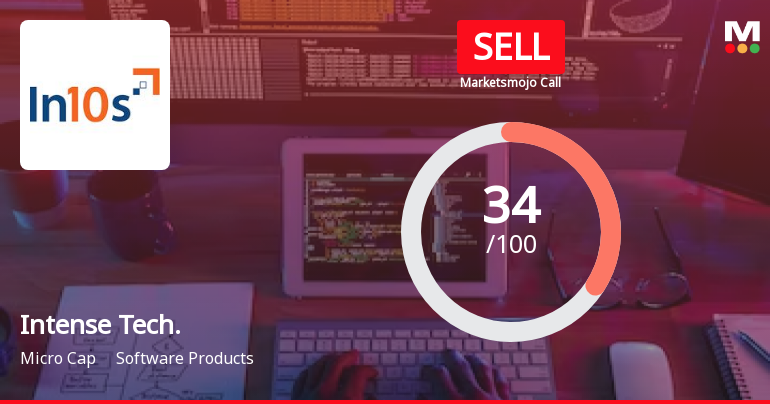
Intense Tech.

  • Market Cap: Micro Cap
  • Industry: Software Products
  • ISIN: INE781A01025
  • NSEID: INTENTECH
  • BSEID: 532326
INR
83.79
-4.11 (-4.68%)
BSENSE

Jul 30, 04:01 PM

BSE+NSE Vol: 1.4 lacs

  • Price Points
  • Score
  • Mojo Parameters
  • Total Return
  • News and Corporate Actions
  • Key factors
  • Shareholding
  • Financials
  • CompanyCV
stock-summaryPrice Point
High/Low

1Day

52 Week

Valuation
Technical
Day's Volume

CASH

1.4 lacs (104.44%) Volume

Shareholding (Jun 2026)

FII

6.87%

Held by 2 FIIs

DII

0.00%

Held by 0 DIIs

Promoter

4.68%

Why is Intense Technologies Ltd falling/rising?

30-Jul-2026

As of 29-Jul, Intense Technologies Ltd's stock price is at 87.90, down -0.58% and has declined -4.3% over the past five days. The stock has significantly underperformed the Sensex with a year-to-date drop of -22.96%, indicating a persistent bearish trend and reduced investor interest.

As of 29-Jul, Intense Technologies Ltd's stock price is falling, currently at 87.90, reflecting a change of -0.51 (-0.58%). The stock has been on a downward trend, having underperformed the sector by -2.74% today and experiencing a consecutive decline over the last five days, with a total drop of -4.3% during this period. <BR><BR>In terms of performance relative to benchmarks, the stock has significantly underperformed the Sensex, with a year-to-date decline of -22.96% compared to the Sensex's -8.88%. Additionally, the stock is trading below its moving averages across various time frames, including the 5-day, 20-day, 50-day, 100-day, and 200-day averages, indicating a persistent bearish trend. <BR><BR>Investor participation has also decreased, with delivery volume dropping by -26.76% against the 5-day average, suggesting reduced interest in trading the stock. Overall, these factors contribute to the ongoing decline in Intense Technologies Ltd's stock price.

View full answer

Should I buy, sell or hold Intense Technologies Ltd?

23-Jun-2026

What does Intense Tech. do?

11-Jun-2026

Intense Technologies Ltd is a software development company, incorporated in 1990, specializing in software products and solutions. As of March 2026, it reported net sales of 28 Cr and a net loss of 22 Cr, with a market cap of INR 240 Cr.

Overview:<BR>Intense Technologies Ltd is a software products and solutions development enterprise operating in the Micro Cap category within the Software Products industry.<BR><BR>History:<BR>The company was incorporated in 1990 as 'Fortune Informatics Private Limited', became a Public Limited Company in 1999, and changed its name to Intense Technologies Limited in 2006. The latest quarterly results reported net sales and net profit for the period ending March 2026.<BR><BR>Financial Snapshot:<BR>- Net Sales: 28 Cr (Quarterly Results - Mar 2026)<BR>- Net Profit: -22 Cr (Quarterly Results - Mar 2026)<BR>- Market Cap: INR 240 Cr (Micro Cap)<BR><BR>Key Metrics:<BR>- P/E: 15.00<BR>- Industry P/E: 20<BR>- Dividend Yield: 1.03%<BR>- Debt Equity: -0.43<BR>- Return on Equity: 12.78%<BR>- Price to Book: 1.83<BR><BR>Contact Details:<BR>- Address: A-1 Vikrampuri, Secunderabad Telangana: 500009<BR>- Phone: 91-040-44558585/27849019/27844551<BR>- Email: tejaswi@intense.in<BR>- Website: http://www.in10stech.com

View full answer

How big is Intense Tech.?

11-Jun-2026

As of 10th June, Intense Technologies Ltd has a market capitalization of 240.00 Cr, with recent net sales of 125.43 Cr and a net profit loss of 15.65 Cr over the latest four quarters.

As of 10th June, <BR><BR>Market Cap: Intense Technologies Ltd has a market capitalization of 240.00 Cr and is classified as a Micro Cap.<BR><BR>Recent Quarterly Performance: The sum of Net Sales for the latest 4 quarters is 125.43 Cr, while the sum of Net Profit for the same period reflects a loss of 15.65 Cr.<BR><BR>Balance Sheet Snapshot: The reporting period is March 2025, with Shareholder's Funds amounting to 141.22 Cr and Total Assets valued at 172.81 Cr.

View full answer

Who are in the management team of Intense Tech.?

11-Jun-2026

The management team of Intense Tech includes C K Shastri (Chairman & Managing Director), Jayant Dwarkanath (Whole-time Director), Tikam Sujan (Director), and several independent directors: V Sarda Devi, P Pavan Kumar, K S Shanker Rao, and V S Mallick, along with Anisha Chidella (Whole-time Director) and Pratyusha Podugu (Company Secretary & Compliance Officer). They are responsible for the company's governance and strategic direction.

The management team of Intense Tech includes the following individuals:<BR><BR>1. **C K Shastri** - Chairman & Managing Director<BR>2. **Jayant Dwarkanath** - Whole-time Director<BR>3. **Tikam Sujan** - Director<BR>4. **V Sarda Devi** - Independent Director<BR>5. **P Pavan Kumar** - Independent Director<BR>6. **K S Shanker Rao** - Independent Director<BR>7. **V S Mallick** - Independent Director<BR>8. **Anisha Chidella** - Whole-time Director<BR>9. **Pratyusha Podugu** - Company Secretary & Compliance Officer<BR><BR>This team plays a crucial role in the governance and strategic direction of the company.

View full answer

Who are the peers of the Intense Tech.?

11-Jun-2026

Intense Tech.'s peers include ABM Knowledge, Artificial Elect, Atishay, Avance Tech., Virinchi, Ace Soft. Exp., and Xelpmoc Design. Intense Tech. has average management risk and a 1-year return of 1.43%, lower than the highest peer return of 317.12% from Omega Interactiv.

Peers: The peers of Intense Tech. are ABM Knowledge, Artificial Elect, Atishay, Avance Tech., Virinchi, Ace Soft. Exp., and Xelpmoc Design.<BR><BR>Quality Snapshot: Excellent management risk is observed at Artificial Elect and ABM Knowledge, while Average management risk is found at Intense Tech., Atishay, and the rest. Below Average management risk is present at Avance Tech., Virinchi, Ace Soft. Exp., and Xelpmoc Design. Growth is Excellent at Artificial Elect, Average at Atishay and Intense Tech., and Below Average at Avance Tech., Virinchi, Ace Soft. Exp., and Xelpmoc Design. Capital Structure is Excellent at ABM Knowledge and Intense Tech., Good at Atishay and Ace Soft. Exp., and Below Average at Avance Tech., Virinchi, and Xelpmoc Design.<BR><BR>Return Snapshot: The peer with the highest 1-year return is Omega Interactiv at 317.12%, while the lowest is Artificial Elect at -64.24%. Intense Tech.'s own 1-year return is 1.43%, which is significantly lower than Omega Interactiv's but higher than Artificial Elect's. Additionally, Avance Tech., Virinchi, Ace Soft. Exp., and Xelpmoc Design all have negative six-month returns.

View full answer

How has been the historical performance of Intense Tech.?

01-Dec-2025

Intense Tech has shown consistent growth in net sales and profits, with net sales increasing from INR 68.65 crore in March 2020 to INR 149.80 crore in March 2025, and profit before tax reaching INR 20.38 crore in the same period. The company's total assets and cash flow from operating activities have also improved significantly.

Answer:<BR>The historical performance of Intense Tech shows a consistent growth trajectory in net sales and profits over the years.<BR><BR>Breakdown:<BR>Intense Tech's net sales have increased significantly from INR 68.65 crore in March 2020 to INR 149.80 crore in March 2025, reflecting a strong upward trend. Total operating income followed a similar pattern, rising from INR 56.72 crore in March 2019 to INR 149.80 crore in March 2025. The company's total expenditure, excluding depreciation, also grew from INR 45.30 crore in March 2019 to INR 128.17 crore in March 2025, indicating increased operational costs alongside revenue growth. Operating profit (PBDIT) fluctuated, peaking at INR 25.69 crore in March 2022 before settling at INR 25.54 crore in March 2025. Profit before tax showed a steady increase, reaching INR 20.38 crore in March 2025, while profit after tax was reported at INR 16.32 crore for the same period. The company's total assets rose from INR 73.33 crore in March 2020 to INR 172.81 crore in March 2025, with total liabilities also increasing from INR 73.33 crore to INR 172.81 crore during the same timeframe. Cash flow from operating activities improved, with a net cash inflow of INR 7.00 crore in March 2025, up from INR 4.00 crore in March 2020. Overall, Intense Tech has demonstrated robust growth in sales, profits, and asset accumulation over the years.

View full answer

Is Intense Tech. overvalued or undervalued?

14-Oct-2025

As of October 13, 2025, Intense Tech. is considered very expensive and overvalued compared to its peers, with a PE ratio of 30.48 and significant underperformance in the past year despite a strong three-year return.

As of 13 October 2025, the valuation grade for Intense Tech. has moved from expensive to very expensive, indicating a significant shift in its perceived value. The company is currently considered overvalued. Key ratios highlight this concern, with a PE ratio of 30.48, an EV to EBIT of 39.48, and a Price to Book Value of 2.21, all of which are substantially higher than industry norms.<BR><BR>In comparison to peers, Intense Tech. stands out unfavorably; for instance, TCS, which is rated attractive, has a PE of 21.63 and an EV to EBITDA of 8.45, while Infosys, rated fair, has a PE of 22.75 and an EV to EBITDA of 14.94. These comparisons further reinforce the notion that Intense Tech. is overvalued relative to its industry peers. Notably, while Intense Tech. has outperformed the Sensex over the past three years with a return of 87.30%, its one-year performance of -16.95% suggests underlying weaknesses that may not be reflected in its current valuation.

View full answer

Are Intense Tech. latest results good or bad?

11-Oct-2025

Intense Technologies' latest results are disappointing, with a 63.6% year-on-year decline in net profit to ₹3 crores and a 20% drop in revenue to ₹33 crores, marking the fourth consecutive quarter of revenue decline. The market reacted negatively, with the stock falling by 3.29% following the announcement.

Intense Technologies' latest results can be characterized as disappointing. In the second quarter of FY26, the company reported a consolidated net profit of ₹3 crores, which represents a significant decline of 63.6% year-on-year from ₹5 crores in the same quarter last year. Additionally, revenue fell by 20% year-on-year to ₹33 crores, marking the fourth consecutive quarter of revenue decline compared to the previous year.<BR><BR>While there was a sequential improvement with net profit increasing by 153.6% from a weak ₹1 crore in the previous quarter, this does not overshadow the overall negative trend in profitability and revenue. The operating margin also compressed sharply to 10.69%, down from 16.27% a year ago, indicating operational challenges.<BR><BR>The market reacted negatively to these results, with the stock declining by 3.29% to ₹138 following the announcement. Overall, the performance reflects significant operational stress and raises concerns about the company's ability to sustain profitability in the current environment.

View full answer

When is the next results date for Intense Tech.?

07-Oct-2025

Intense Tech. will announce its results on 10 October 2025.

Intense Tech. will declare its results on 10 October 2025.

View full answer

Who are the top shareholders of the Intense Tech.?

17-Jul-2025

The top shareholders of Intense Tech are Krishna Shastri Chidella with 10.76%, followed by public shareholder Jayant Dwarkanath at 5.51%. Individual investors hold 56.44%, with no pledged promoter holdings or mutual fund involvement.

The top shareholders of Intense Tech include Krishna Shastri Chidella, who is the promoter with the highest holding at 10.76%. The highest public shareholder is Jayant Dwarkanath, holding 5.51%. Additionally, individual investors collectively hold a significant portion of 56.44%. The company has no pledged promoter holdings and is held by one foreign institutional investor at 0.04%. There are currently no mutual funds involved with the company.

View full answer

What is the technical trend for Intense Tech.?

09-Jun-2025

As of May 19, 2025, Intense Tech's technical trend is mildly bearish, influenced by daily moving averages and a bearish monthly MACD, despite some mixed signals from the weekly MACD and other indicators.

As of 19 May 2025, the technical trend for Intense Tech has changed from sideways to mildly bearish. The weekly MACD indicates a mildly bullish stance, but the monthly MACD is mildly bearish, suggesting mixed signals. The daily moving averages are also mildly bearish, reinforcing the negative outlook. The Bollinger Bands on the monthly chart show a mildly bearish trend, while the KST and OBV on the weekly are mildly bullish and mildly bearish, respectively. Overall, the current technical stance is mildly bearish, driven primarily by the daily moving averages and the monthly MACD.

View full answer

Has Intense Tech. declared dividend?

06-Jun-2025

Intense Technologies Ltd has declared a 50% dividend, with an ex-date of September 23, 2024. While recent returns have been mixed, the company has shown significant long-term growth, particularly with a 468.25% price return over the past five years.

Intense Technologies Ltd has declared a 50% dividend.<BR><BR>Dividend Details:<BR>- Percentage announced: 50%<BR>- Ex-date: 23 Sep 24<BR><BR>Dividend Yield: 1%<BR><BR>Total Returns by Period:<BR>In the last 6 months, the price return was -23.88%, with no dividend return, resulting in a total return of -23.88%.<BR><BR>Over the past year, the price return was -9.81%, with a dividend return of 0.69%, leading to a total return of -9.12%.<BR><BR>In the 2-year period, the price return was 58.68%, with a dividend return of 2.27%, culminating in a total return of 60.95%.<BR><BR>For the 3-year period, the price return was 36.09%, with a dividend return of 3.21%, resulting in a total return of 39.3%.<BR><BR>In the last 4 years, the price return was 37.1%, with a dividend return of 3.26%, leading to a total return of 40.36%.<BR><BR>Over the past 5 years, the price return was an impressive 468.25%, with a dividend return of 9.06%, resulting in a total return of 477.31%.<BR><BR>Overall, Intense Technologies Ltd has declared a dividend, and while recent returns have been mixed, the long-term performance shows significant growth, particularly in price returns over the past five years.

View full answer
iScoreScore
Click here to find our call on this stock
Strong Sell
Sell
Hold
Buy
Strong Buy

Dashboard

1

Poor long term growth as Operating profit has grown by an annual rate -22.84% of over the last 5 years

 
2

With ROE of 12.8, it has a Very Expensive valuation with a 1.7 Price to Book Value

stock-summaryMojo Parameters

Mojo Parameters

Loading Valuation Snapshot...

Stock DNA

stock-summary
Industry

Software Products

stock-summary
Market cap

INR 198 Cr (Micro Cap)

stock-summary
P/E

13.00

stock-summary
Industry P/E

21

stock-summary
Dividend Yield

1.14%

stock-summary
Debt Equity

-0.43

stock-summary
Return on Equity

12.78%

stock-summary
Price to Book

1.66

Revenue and Profits:
Net Sales:
28 Cr
(Quarterly Results - Mar 2026)
Net Profit:
-22 Cr
stock-summaryTotal Returns
Total Returns (Price + Dividend) stock-summary
Dividend Yield (1.14%)
TimePeriod
Price Return
Dividend Return
Total Return
3 Months
-14.43%
0%
-14.43%
6 Months
-25.45%
0%
-25.45%
1 Year
0.95%
1.19%
2.14%
2 Years
-46.43%
1.25%
-45.18%
3 Years
0.54%
3.14%
3.68%
4 Years
19.87%
4.35%
24.22%
5 Years
-22.92%
4.61%
-18.31%

Latest dividend: 1 per share ex-dividend date: Sep-23-2025

Risk Adjusted Returns v/s stock-summary
Returns Beta
Icon
Beta has not been calculated since enough price history is not available
stock-summaryNews & Corporate Actions

News

Announcements stock-summary

Compliances-Certificate under Reg. 74 (5) of SEBI (DP) Regulations 2018

06-Jul-2026 | Source : BSE

Please find enclosed the certificate under Reg 74(5) of SEBI (DP) Regulations issued by RTA

Closure of Trading Window

29-Jun-2026 | Source : BSE

This is to inform that the trading window for dealing in equity shares of the company by designated persons along with their immediate relatives will be closed from July 1st 2026 till 48 hours after declaration of un-audited Financial Results for the quarter ended June 30 2026

Announcement under Regulation 30 (LODR)-Resignation of Managing Director

19-Jun-2026 | Source : BSE

Please find enclosed the Resignation letter received from Mr. C.K. Shastri Founder and Managing director of the company citing his age and health factors with effect from closing of business hours of June 19th 2026.

Corporate Actions stock-summary

stock-summary
BOARD MEETING

No Upcoming Board Meetings

stock-summary
DIVIDEND

Intense Technologies Ltd has declared 50% dividend, ex-date: 23 Sep 25

stock-summary
SPLITS

No Splits history available

stock-summary
BONUS

No Bonus history available

stock-summary
RIGHTS

No Rights history available

stock-summaryKey Factors

Quality key factors stock-summary

Factor
Value
Sales Growth (5y)
11.73%
EBIT Growth (5y)
-22.84%
EBIT to Interest (avg)
16.06
Debt to EBITDA (avg)
Net Debt is too low
Net Debt to Equity (avg)
-0.43
Sales to Capital Employed (avg)
0.92
Tax Ratio
28.32%
Dividend Payout Ratio
14.28%
Pledged Shares
0
Institutional Holding
6.87%
ROCE (avg)
18.78%
ROE (avg)
13.69%

Valuation key factors

Factor
Value
P/E Ratio
13
Industry P/E
21
Price to Book Value
1.66
EV to EBIT
27.07
EV to EBITDA
12.53
EV to Capital Employed
2.16
EV to Sales
1.23
PEG Ratio
NA
Dividend Yield
1.14%
ROCE (Latest)
7.97%
ROE (Latest)
12.78%

Technicals key factors

Indicator
Weekly
Monthly
MACD
Bearish
Bearish
RSI
No Signal
No Signal
Bollinger Bands
Bearish
Bearish
Moving Averages
Bearish (Daily)
KST
Bearish
Mildly Bullish
Dow Theory
Mildly Bearish
Mildly Bearish
OBV
Mildly Bullish
No Trend
stock-summary Technical Indicator Scale: Bearish, Mildly Bearish, Sideways, Mildly Bullish, Bullish  Turned 
stock-summaryShareholding
Shareholding Snapshot : Jun 2026stock-summary
Shareholding Compare (%holding) stock-summary
Majority shareholders

Non Institution

Pledged Promoter Holdings

None

Mutual Funds

Held by 0 Schemes

FIIs

Held by 2 FIIs (6.87%)

Promoter with highest holding

C K Shastri (3.7%)

Highest Public shareholder

Yudiz Solutions Limited (10.52%)

Individual Investors Holdings

58.8%

stock-summaryFinancial
[
  {
    "link": "quarterly",
    "btn_text": "All Quarterly Results",
    "header": "Quarterly Results Snapshot (Consolidated) - Mar'26 - QoQ",
    "rhs": [
      {
        "prefix": "Net Sales ",
        "suffix": "QoQ Growth in quarter ended Mar 2026 is -15.53% vs -0.54% in Dec 2025",
        "dir": -1
      },
      {
        "prefix": "Consolidated Net Profit ",
        "suffix": "QoQ Growth in quarter ended Mar 2026 is -1,065.09% vs -26.81% in Dec 2025",
        "dir": -1
      }
    ],
    "table": {
      "header": [
        "Mar'26",
        "Dec'25",
        "Change(%)"
      ],
      "body": [
        {
          "field": "Net Sales",
          "val1": "28.13",
          "val2": "33.30",
          "chgp": "-15.53%",
          "chgp_class": "negative"
        },
        {
          "field": "Operating Profit (PBDIT) excl Other Income",
          "val1": "3.16",
          "val2": "3.35",
          "chgp": "-5.67%",
          "chgp_class": "negative"
        },
        {
          "field": "Interest",
          "val1": "0.06",
          "val2": "0.05",
          "chgp": "20.00%",
          "chgp_class": "negative"
        },
        {
          "field": "Exceptional Items",
          "val1": "-31.65",
          "val2": "0.00",
          "chgp": "",
          "chgp_class": "neutral"
        },
        {
          "field": "Consolidate Net Profit",
          "val1": "-22.39",
          "val2": "2.32",
          "chgp": "-1,065.09%",
          "chgp_class": "negative"
        },
        {
          "field": "Operating Profit Margin (Excl OI)",
          "val1": "11.23%",
          "val2": "10.06%",
          "chgp": "1.17%",
          "chgp_class": "positive"
        }
      ]
    }
  },
  {
    "link": "half-yearly",
    "btn_text": "All Half Yearly Results",
    "header": "Half Yearly Results Snapshot (Consolidated) - Sep'25",
    "rhs": [
      {
        "prefix": "Net Sales ",
        "suffix": " Growth in half year ended Sep 2025 is -21.19% vs 44.48% in Sep 2024",
        "dir": -1
      },
      {
        "prefix": "Consolidated Net Profit ",
        "suffix": " Growth in half year ended Sep 2025 is -57.98% vs 26.29% in Sep 2024",
        "dir": -1
      }
    ],
    "table": {
      "header": [
        "Sep'25",
        "Sep'24",
        "Change(%)"
      ],
      "body": [
        {
          "field": "Net Sales",
          "val1": "64.00",
          "val2": "81.21",
          "chgp": "-21.19%",
          "chgp_class": "negative"
        },
        {
          "field": "Operating Profit (PBDIT) excl Other Income",
          "val1": "5.77",
          "val2": "14.41",
          "chgp": "-59.96%",
          "chgp_class": "negative"
        },
        {
          "field": "Interest",
          "val1": "0.23",
          "val2": "0.12",
          "chgp": "91.67%",
          "chgp_class": "negative"
        },
        {
          "field": "Exceptional Items",
          "val1": "0.00",
          "val2": "0.00",
          "chgp": "",
          "chgp_class": "neutral"
        },
        {
          "field": "Consolidate Net Profit",
          "val1": "4.42",
          "val2": "10.52",
          "chgp": "-57.98%",
          "chgp_class": "negative"
        },
        {
          "field": "Operating Profit Margin (Excl OI)",
          "val1": "9.02%",
          "val2": "17.74%",
          "chgp": "-8.72%",
          "chgp_class": "negative"
        }
      ]
    }
  },
  {
    "link": "nine-monthly",
    "btn_text": "All Nine Monthly Results",
    "header": "Nine Monthly Results Snapshot (Consolidated) - Dec'25",
    "rhs": [
      {
        "prefix": "Net Sales ",
        "suffix": "YoY Growth in nine months ended Dec 2025 is -15.00% vs 37.34% in Dec 2024",
        "dir": -1
      },
      {
        "prefix": "Consolidated Net Profit ",
        "suffix": "YoY Growth in nine months ended Dec 2025 is -50.48% vs 7.76% in Dec 2024",
        "dir": -1
      }
    ],
    "table": {
      "header": [
        "Dec'25",
        "Dec'24",
        "Change(%)"
      ],
      "body": [
        {
          "field": "Net Sales",
          "val1": "97.30",
          "val2": "114.47",
          "chgp": "-15.00%",
          "chgp_class": "negative"
        },
        {
          "field": "Operating Profit (PBDIT) excl Other Income",
          "val1": "9.12",
          "val2": "17.88",
          "chgp": "-48.99%",
          "chgp_class": "negative"
        },
        {
          "field": "Interest",
          "val1": "0.28",
          "val2": "0.19",
          "chgp": "47.37%",
          "chgp_class": "negative"
        },
        {
          "field": "Exceptional Items",
          "val1": "0.00",
          "val2": "0.00",
          "chgp": "",
          "chgp_class": "neutral"
        },
        {
          "field": "Consolidate Net Profit",
          "val1": "6.74",
          "val2": "13.61",
          "chgp": "-50.48%",
          "chgp_class": "negative"
        },
        {
          "field": "Operating Profit Margin (Excl OI)",
          "val1": "9.37%",
          "val2": "15.62%",
          "chgp": "-6.25%",
          "chgp_class": "negative"
        }
      ]
    }
  },
  {
    "link": "annual",
    "btn_text": "All Annual Results",
    "header": "Annual Results Snapshot (Consolidated) - Mar'26",
    "rhs": [
      {
        "prefix": "Net Sales ",
        "suffix": "YoY Growth in year ended Mar 2026 is -16.27% vs 30.84% in Mar 2025",
        "dir": -1
      },
      {
        "prefix": "Consolidated Net Profit ",
        "suffix": "YoY Growth in year ended Mar 2026 is -195.89% vs 4.35% in Mar 2025",
        "dir": -1
      }
    ],
    "table": {
      "header": [
        "Mar'26",
        "Mar'25",
        "Change(%)"
      ],
      "body": [
        {
          "field": "Net Sales",
          "val1": "125.43",
          "val2": "149.80",
          "chgp": "-16.27%",
          "chgp_class": "negative"
        },
        {
          "field": "Operating Profit (PBDIT) excl Other Income",
          "val1": "12.18",
          "val2": "21.53",
          "chgp": "-43.43%",
          "chgp_class": "negative"
        },
        {
          "field": "Interest",
          "val1": "0.25",
          "val2": "0.16",
          "chgp": "56.25%",
          "chgp_class": "negative"
        },
        {
          "field": "Exceptional Items",
          "val1": "-31.65",
          "val2": "0.00",
          "chgp": "",
          "chgp_class": "neutral"
        },
        {
          "field": "Consolidate Net Profit",
          "val1": "-15.65",
          "val2": "16.32",
          "chgp": "-195.89%",
          "chgp_class": "negative"
        },
        {
          "field": "Operating Profit Margin (Excl OI)",
          "val1": "9.71%",
          "val2": "14.37%",
          "chgp": "-4.66%",
          "chgp_class": "negative"
        }
      ]
    }
  }
]

Quarterly Results Snapshot (Consolidated) - Mar'26 - QoQstock-summary

Mar'26
Dec'25
Change(%)
Net Sales
28.13
33.30
-15.53%
Operating Profit (PBDIT) excl Other Income
3.16
3.35
-5.67%
Interest
0.06
0.05
20.00%
Exceptional Items
-31.65
0.00
Consolidate Net Profit
-22.39
2.32
-1,065.09%
Operating Profit Margin (Excl OI)
11.23%
10.06%
1.17%
Values in Rs Cr.
Direction Arrows
Net Sales

QoQ Growth in quarter ended Mar 2026 is -15.53% vs -0.54% in Dec 2025

Direction Arrows
Consolidated Net Profit

QoQ Growth in quarter ended Mar 2026 is -1,065.09% vs -26.81% in Dec 2025

Half Yearly Results Snapshot (Consolidated) - Sep'25stock-summary

Sep'25
Sep'24
Change(%)
Net Sales
64.00
81.21
-21.19%
Operating Profit (PBDIT) excl Other Income
5.77
14.41
-59.96%
Interest
0.23
0.12
91.67%
Exceptional Items
0.00
0.00
Consolidate Net Profit
4.42
10.52
-57.98%
Operating Profit Margin (Excl OI)
9.02%
17.74%
-8.72%
Values in Rs Cr.
Direction Arrows
Net Sales

Growth in half year ended Sep 2025 is -21.19% vs 44.48% in Sep 2024

Direction Arrows
Consolidated Net Profit

Growth in half year ended Sep 2025 is -57.98% vs 26.29% in Sep 2024

Nine Monthly Results Snapshot (Consolidated) - Dec'25stock-summary

Dec'25
Dec'24
Change(%)
Net Sales
97.30
114.47
-15.00%
Operating Profit (PBDIT) excl Other Income
9.12
17.88
-48.99%
Interest
0.28
0.19
47.37%
Exceptional Items
0.00
0.00
Consolidate Net Profit
6.74
13.61
-50.48%
Operating Profit Margin (Excl OI)
9.37%
15.62%
-6.25%
Values in Rs Cr.
Direction Arrows
Net Sales

YoY Growth in nine months ended Dec 2025 is -15.00% vs 37.34% in Dec 2024

Direction Arrows
Consolidated Net Profit

YoY Growth in nine months ended Dec 2025 is -50.48% vs 7.76% in Dec 2024

Annual Results Snapshot (Consolidated) - Mar'26stock-summary

Mar'26
Mar'25
Change(%)
Net Sales
125.43
149.80
-16.27%
Operating Profit (PBDIT) excl Other Income
12.18
21.53
-43.43%
Interest
0.25
0.16
56.25%
Exceptional Items
-31.65
0.00
Consolidate Net Profit
-15.65
16.32
-195.89%
Operating Profit Margin (Excl OI)
9.71%
14.37%
-4.66%
Values in Rs Cr.
Direction Arrows
Net Sales

YoY Growth in year ended Mar 2026 is -16.27% vs 30.84% in Mar 2025

Direction Arrows
Consolidated Net Profit

YoY Growth in year ended Mar 2026 is -195.89% vs 4.35% in Mar 2025

stock-summaryCompany CV
About Intense Technologies Ltd stock-summary
stock-summary
Intense Technologies Ltd
Micro Cap
Software Products
Intense Technologies Limited was formerly incorporated as 'Fortune Informatics Private Limited' on July 24, 1990. Thereafter, it became a Public Limited Company and the name of the Company was changed to Fortune Informatics Limited on February 28, 1999 and further to Intense Technologies Limited on November 7, 2006. The Company is a software products and solutions development enterprise with its corporate office and operational base at Hyderabad.
Company Coordinates stock-summary
Company Details
A-1 Vikrampuri , Secunderabad Telangana : 500009
stock-summary
Tel: 91-040-44558585/27849019/27844551
stock-summary
tejaswi@intense.in
Registrar Details
Karvy Computershare Pvt Ltd, Plot No 17-24 , Near Image Hospital,, Reliance Cybervilae,Vithalrao Nagar,, Madhapur, Hyderabad