
Compare Kirl. Brothers with Similar Stocks
Dashboard
High Management Efficiency with a high ROE of 16.31%
The company is Net-Debt Free
Poor long term growth as Net Sales has grown by an annual rate of 10.81% over the last 5 years
Flat results in Mar 26
With ROE of 16.5, it has a Expensive valuation with a 6.5 Price to Book Value
Majority shareholders : Promoters
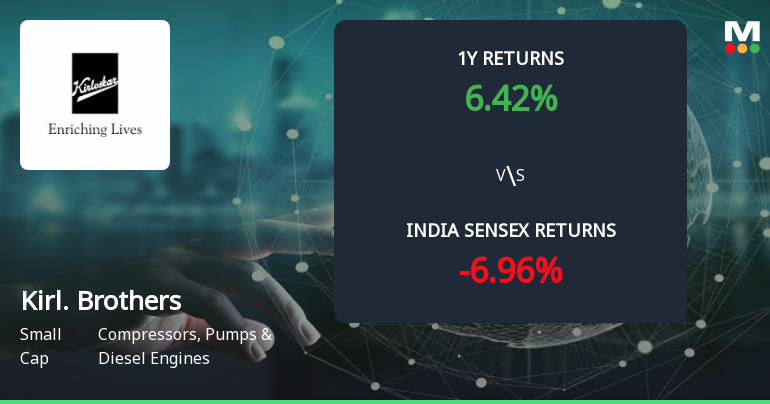
Market Beating performance in long term as well as near term
With its market cap of Rs 16,461 cr, it is the second biggest company in the sector (behind Elgi Equipments)and constitutes 18.73% of the entire sector
Stock DNA
Compressors, Pumps & Diesel Engines
INR 16,651 Cr (Small Cap)
39.00
36
0.34%
-0.25
16.47%
6.68
Total Returns (Price + Dividend) 
Latest dividend: 7 per share ex-dividend date: Jul-25-2025
Risk Adjusted Returns v/s
Returns Beta

News
Golden Cross Confirmed: Do Kirloskar Brothers Ltd's Other Technical Indicators Agree?
The 50-day moving average has crossed above the 200-day moving average for Kirloskar Brothers Ltd, signalling a golden cross on 23 Jun 2026. Yet, the stock declined 2.46% on the day the cross formed, while monthly momentum indicators remain mildly bearish. This divergence between the moving averages and price action invites a closer examination of the signal's reliability.
Read full news article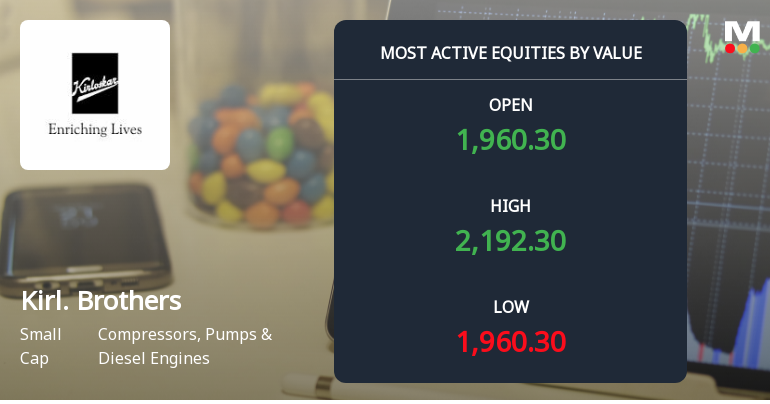
Kirloskar Brothers Ltd Sees Robust Trading Activity Amid Strong Market Momentum
Kirloskar Brothers Ltd (KIRLOSBROS) has emerged as one of the most actively traded stocks by value on 22 June 2026, registering a robust 8.26% gain intraday amid strong institutional participation and sustained buying momentum. The stock’s impressive seven-day rally, delivering a 25.71% return, underscores growing investor confidence in this small-cap player within the Compressors, Pumps & Diesel Engines sector.
Read full news article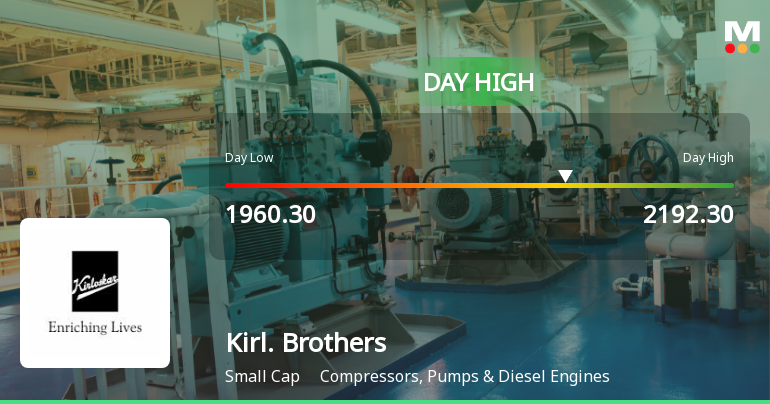
Kirloskar Brothers Ltd Surges 12.46% to Day's High of Rs 2192.3 — Outperforms Sector by 9.48 Percentage Points
The Sensex advanced 0.6% on 22 Jun 2026, yet Kirloskar Brothers Ltd outpaced the market with a remarkable 12.46% gain, reaching an intraday peak of Rs 2192.3. This 9.48 percentage-point outperformance over its sector underscores a distinctly stock-specific rally rather than a broad market lift.
Read full news article Announcements
Publication Pertaining To Transfer Of Shares And Unpaid Dividend To IEPF
05-Jun-2026 | Source : BSEPlease find enclosed herewith a copy of publication pertaining to transfer of shares and unpaid dividend to IEPF
Compliances-Reg.24(A)-Annual Secretarial Compliance
26-May-2026 | Source : BSEPlease find enclosed Annual Secretarial Compliance Report for the Financial Year ended March 31 2026.
Announcement under Regulation 30 (LODR)-Change in Directorate
24-May-2026 | Source : BSEPlease find enclosed herewith the intimation pursuant to Regulation 30 of the SEBI Listing Regulations 2015 pertaining to completion of the term of independent directors.
Corporate Actions

No Upcoming Board Meetings

Kirloskar Brothers Ltd has declared 350% dividend, ex-date: 24 Jul 26

No Splits history available

No Bonus history available

No Rights history available
Quality key factors
Valuation key factors
Technicals key factors
 Technical Indicator Scale: Bearish, Mildly Bearish, Sideways, Mildly Bullish, Bullish Turned
 Shareholding Snapshot : Mar 2026
Shareholding Compare (%holding)
Promoters
None
Held by 14 Schemes (8.08%)
Held by 128 FIIs (6.24%)
Kirloskar Industries Ltd (23.91%)
Nippon Life India Trustee Ltd-a/c Nippon India Small Cap Fund (5.68%)
12.27%
Quarterly Results Snapshot (Consolidated) - Mar'26 - YoY

YoY Growth in quarter ended Mar 2026 is 10.44% vs 4.70% in Mar 2025

YoY Growth in quarter ended Mar 2026 is -18.67% vs -9.92% in Mar 2025
Half Yearly Results Snapshot (Consolidated) - Sep'25
Growth in half year ended Sep 2025 is -2.90% vs 14.02% in Sep 2024
Growth in half year ended Sep 2025 is -14.37% vs 40.93% in Sep 2024
Nine Monthly Results Snapshot (Consolidated) - Dec'25
YoY Growth in nine months ended Dec 2025 is -2.74% vs 15.61% in Dec 2024
YoY Growth in nine months ended Dec 2025 is -5.76% vs 41.84% in Dec 2024
Annual Results Snapshot (Consolidated) - Mar'26
YoY Growth in year ended Mar 2026 is 1.02% vs 12.27% in Mar 2025
YoY Growth in year ended Mar 2026 is -10.04% vs 19.24% in Mar 2025
About Kirloskar Brothers Ltd

Company Coordinates


