Ingersoll-Rand

  • Market Cap: Small Cap
  • Industry: Compressors, Pumps & Diesel Engines
  • ISIN: INE177A01018
  • NSEID: INGERRAND
  • BSEID: 500210
INR
3,638.40
-44.3 (-1.2%)
BSENSE

Dec 05

BSE+NSE Vol: 8.29 k

  • Price Points
  • Score
  • Mojo Parameters
  • Total Return
  • News and Corporate Actions
  • Key factors
  • Shareholding
  • Financials
  • CompanyCV
stock-summaryPrice Point
High/Low

1Day

52 Week

Valuation
Technical
Day's Volume

CASH

8.29 k (-27.88%) Volume

Shareholding (Sep 2025)

FII

1.31%

Held by 82 FIIs

DII

0.03%

Held by 10 DIIs

Promoter

75.00%

What does Ingersoll-Rand do?

06-Jun-2025

Ingersoll-Rand (India) Ltd is a mid-cap company specializing in compressors, pumps, and diesel engines, with net sales of 322 Cr and a net profit of 68 Cr as of March 2025. It has a market cap of Rs 12,010 Cr and key metrics include a P/E of 45.00 and a dividend yield of 1.98%.

Overview:<BR>Ingersoll-Rand (India) Ltd is a leading innovation and solutions provider in the Compressors, Pumps & Diesel Engines industry, classified as a Mid Cap company.<BR><BR>History:<BR>Ingersoll-Rand (India) Ltd was incorporated in an unspecified year and has maintained its status as a prominent player in its industry. The latest quarterly results reported are for March 2025, showcasing the company's ongoing operations.<BR><BR>Financial Snapshot:<BR>- Net Sales: 322 Cr (Quarterly Results - Mar 2025)<BR>- Net Profit: 68 Cr (Quarterly Results - Mar 2025)<BR>- Market Cap: Rs 12,010 Cr (Mid Cap)<BR><BR>Key Metrics:<BR>- P/E: 45.00<BR>- Industry P/E: 40<BR>- Dividend Yield: 1.98%<BR>- Debt Equity: -0.45<BR>- Return on Equity: 41.85%<BR>- Price to Book: 18.68<BR><BR>Contact Details:<BR>Address: First Floor Subramanya Arcade, No 12/1 Bannerghatta Road Bangalore Karnataka : 560029<BR>Tel: 91-80-46855100<BR>Email: p_r_shubhakar@irco.com<BR>Website: http://www.irco.com

Read More

Has Ingersoll-Rand declared dividend?

06-Jun-2025

Yes, Ingersoll-Rand (India) Ltd has declared a 550% dividend, amounting to ₹55 per share, with an ex-date of November 27, 2024. Despite recent short-term declines, the company has shown strong total returns over longer periods, particularly in the last 3 to 5 years.

Ingersoll-Rand (India) Ltd has declared a 550% dividend.<BR><BR>Dividend Details:<BR>- Percentage announced: 550%<BR>- Amount per share: 55<BR>- Ex-date: 27 Nov 2024<BR><BR>Dividend Yield: 1.98%.<BR><BR>Total Returns by Period:<BR>In the last 6 months, the price return was -14.46%, with a dividend return of 0%, resulting in a total return of -14.46%.<BR><BR>Over the past year, the price return was -15.63%, while the dividend return was 1.64%, leading to a total return of -13.99%.<BR><BR>In the 2-year period, the price return was 39.59% and the dividend return was 4.99%, culminating in a total return of 44.58%.<BR><BR>For the 3-year period, the price return was 153.41%, with a dividend return of 13.60%, resulting in a total return of 167.01%.<BR><BR>In the last 4 years, the price return was 289.31%, while the dividend return was 19.46%, leading to a total return of 308.77%.<BR><BR>Over the 5-year period, the price return was 498.76%, and the dividend return was 30.55%, resulting in a total return of 529.31%.<BR><BR>Overall, Ingersoll-Rand has declared a substantial dividend, which contributes positively to its total returns over longer periods, particularly in the 3 to 5-year range, indicating strong performance despite some recent declines in shorter periods.

Read More

Is Ingersoll-Rand overvalued or undervalued?

09-Jun-2025

As of September 17, 2021, Ingersoll-Rand is considered very expensive and overvalued with a high PE ratio of 45.02, despite strong operational efficiency metrics, as it has underperformed the Sensex with a YTD return of -8.80%.

As of 17 September 2021, the valuation grade for Ingersoll-Rand moved from expensive to very expensive. The company is currently overvalued, as indicated by its high PE ratio of 45.02, a Price to Book Value of 18.84, and an EV to EBITDA of 33.80. Compared to its peers, Ingersoll-Rand's valuation metrics are notably elevated; for instance, Elgi Equipments has a PE of 47.88 and KSB has a PE of 59.09, both of which are also categorized as very expensive.<BR><BR>Despite its strong ROCE of 82.80% and ROE of 41.85%, which suggest operational efficiency, the high valuation ratios indicate that the stock may not provide a favorable risk-reward scenario at its current price of 3806.80. Recent performance shows that Ingersoll-Rand has underperformed the Sensex, with a YTD return of -8.80% compared to the Sensex's 5.62%, reinforcing the notion of overvaluation in the current market context.

Read More

Who are the peers of the Ingersoll-Rand?

16-Jul-2025

Ingersoll-Rand's peers include Cummins India, Kirl. Brothers, Elgi Equipments, KSB, Kirloskar Oil, Shakti Pumps, Kirl.Pneumatic, Oswal Pumps, and Swaraj Engines. Shakti Pumps has the highest 1-year return at 32.53%, while Ingersoll-Rand's return is -2.16%.

Peers: The peers of Ingersoll-Rand are Cummins India, Kirl. Brothers, Elgi Equipments, KSB, Kirloskar Oil, Shakti Pumps, Kirl.Pneumatic, Oswal Pumps, and Swaraj Engines.<BR><BR>Quality Snapshot: Excellent management risk is observed at Cummins India and Ingersoll-Rand, while Good management risk is found at Kirl. Brothers, Elgi Equipments, KSB, Kirloskar Oil, Shakti Pumps, Kirl.Pneumatic, and Swaraj Engines, and the rest. Excellent growth is seen at Cummins India, Shakti Pumps, and Oswal Pumps, while Good growth is noted at Ingersoll-Rand, Kirl. Brothers, Elgi Equipments, KSB, Kirloskar Oil, Kirl.Pneumatic, and Swaraj Engines, and the rest. Excellent capital structure is present at Cummins India, Kirl. Brothers, Elgi Equipments, KSB, Shakti Pumps, Kirl.Pneumatic, and Swaraj Engines, while Below Average capital structure is found at Kirloskar Oil.<BR><BR>Return Snapshot: The peer with the highest 1-year return is Shakti Pumps at 32.53%, while the lowest is Elgi Equipments at -22.74%. Ingersoll-Rand's 1-year return is -2.16%, which is higher than Elgi Equipments but lower than Shakti Pumps. Additionally, Shakti Pumps and Greaves Cotton have negative six-month returns.

Read More

Who are in the management team of Ingersoll-Rand?

16-Jul-2025

As of March 2022, the management team of Ingersoll-Rand includes P. R. Shubhakar (Executive Director & Company Secretary), Sekhar Natarajan (Chairman & Independent Director), Jayantika Dave, Vijaya Sampath (both Independent Directors), Naveen Samant (Director), and Inder Arora (Executive Director). This team provides governance and strategic direction for the company.

As of March 2022, the management team of Ingersoll-Rand includes the following individuals:<BR><BR>1. P. R Shubhakar - Executive Director & Company Secretary<BR>2. Sekhar Natarajan - Chairman & Independent Director<BR>3. Jayantika Dave - Independent Director<BR>4. Vijaya Sampath - Independent Director<BR>5. Naveen Samant - Director<BR>6. Inder Arora - Executive Director<BR><BR>This team comprises a mix of executive and independent directors, contributing to the governance and strategic direction of the company.

Read More

Who are the top shareholders of the Ingersoll-Rand?

17-Jul-2025

The top shareholders of Ingersoll-Rand include Ingersoll-Rand Industrial U.S. Inc. with 74.0%, mutual funds with 6.82%, ICICI Prudential Infrastructure Fund at 2.9%, foreign institutional investors at 1.88%, and individual investors holding 12.94%.

The top shareholders of Ingersoll-Rand include Ingersoll-Rand Industrial U.S. Inc., which holds a significant 74.0% of the shares. Other notable shareholders are mutual funds, which collectively hold 6.82% through 13 schemes, and the highest public shareholder, ICICI Prudential Infrastructure Fund, with a 2.9% stake. Additionally, foreign institutional investors (FIIs) hold 1.88% across 95 entities, while individual investors account for 12.94% of the holdings.

Read More

How big is Ingersoll-Rand?

24-Jul-2025

As of 24th July, Ingersoll-Rand (India) Ltd has a market capitalization of 12,851.00 Cr, with net sales of 1,343.70 Cr and a net profit of 267.53 Cr reported in the latest four quarters. The company has shareholder's funds of 609.34 Cr and total assets of 928.97 Cr as of March 2025.

As of 24th July, Ingersoll-Rand (India) Ltd has a market capitalization of 12,851.00 Cr, categorizing it as a Mid Cap company.<BR><BR>In the latest four quarters, Ingersoll-Rand reported net sales of 1,343.70 Cr and a net profit of 267.53 Cr.<BR><BR>For the reporting period of March 2025, the company has shareholder's funds amounting to 609.34 Cr and total assets of 928.97 Cr.

Read More

When is the next results date for Ingersoll-Rand?

05-Aug-2025

Ingersoll-Rand will announce its results on 12 August 2025.

Ingersoll-Rand is scheduled to declare its results on 12 August 2025.

Read More

Are Ingersoll-Rand latest results good or bad?

12-Aug-2025

Ingersoll-Rand's latest financial results are disappointing, with a 10.38% decline in Profit Before Tax and the lowest net sales in five quarters. The stock is rated as a 'Sell' due to concerns about profitability and operational efficiency.

Ingersoll-Rand's latest financial results for the quarter ending June 2025 indicate a disappointing performance. The company reported a Profit Before Tax less Other Income (PBT) of Rs 70.01 crore, which reflects a year-on-year decline of 10.38%. This is the lowest PBT recorded in the last five quarters, signaling a concerning trend in profitability.<BR><BR>Net sales for the quarter were Rs 315.32 crore, also marking a decrease and the lowest figure in the past five quarters. The operating profit, measured as PBDIT, fell to Rs 74.24 crore, contributing to a decline in the operating profit margin to 23.54%, the lowest during this period.<BR><BR>Earnings per share (EPS) dropped to Rs 18.68, indicating lower returns for shareholders. Overall, the financial performance shows a consistent downward trend, raising concerns about the company's operational efficiency and market position. Given these results, the stock has been rated as a 'Sell' by MarketsMOJO, reflecting the challenges currently faced by Ingersoll-Rand.

Read More

How has been the historical performance of Ingersoll-Rand?

15-Nov-2025

Ingersoll-Rand has shown consistent growth in net sales and profitability, with net sales increasing from INR 617.73 crore in March 2021 to INR 1,336.29 crore in March 2025, and earnings per share rising from INR 22.92 to INR 84.74 during the same period. Overall, the company has demonstrated strong financial performance and operational efficiency.

Answer:<BR>The historical performance of Ingersoll-Rand shows a consistent growth trend in net sales and profitability over the years.<BR><BR>Breakdown:<BR>Ingersoll-Rand's net sales have increased significantly from INR 617.73 crore in March 2021 to INR 1,336.29 crore in March 2025, reflecting a strong upward trajectory. The total operating income has followed a similar pattern, rising from INR 617.73 crore in March 2021 to INR 1,336.29 crore in March 2025. The operating profit (PBDIT) has also seen substantial growth, moving from INR 110.68 crore in March 2021 to INR 378.78 crore in March 2025, indicating improved operational efficiency. Profit before tax has increased from INR 107.78 crore in March 2021 to INR 360.36 crore in March 2025, while profit after tax has risen from INR 72.35 crore to INR 267.53 crore during the same period. The earnings per share (EPS) have shown a remarkable increase from INR 22.92 in March 2021 to INR 84.74 in March 2025, demonstrating enhanced shareholder value. On the balance sheet, total assets grew from INR 552.21 crore in March 2020 to INR 928.97 crore in March 2025, while total liabilities increased from INR 552.21 crore to INR 928.97 crore, indicating a balanced growth in both assets and liabilities. Cash flow from operating activities has improved from INR 76 crore in March 2021 to INR 265 crore in March 2025, although net cash flow has seen a decline, indicating increased investment activities. Overall, Ingersoll-Rand has demonstrated strong financial performance and growth over the years.

Read More

Should I buy, sell or hold Ingersoll-Rand?

16-Nov-2025

Is Ingersoll-Rand technically bullish or bearish?

02-Dec-2025

As of December 1, 2025, Ingersoll-Rand's technical trend has shifted to mildly bearish, supported by weekly MACD and Bollinger Bands, despite some daily bullish signals, indicating overall underperformance against the Sensex.

As of 1 December 2025, the technical trend for Ingersoll-Rand has changed from mildly bullish to mildly bearish. The current stance is mildly bearish, driven primarily by the weekly MACD and Bollinger Bands indicating bearish conditions. The KST and Dow Theory also support a mildly bearish outlook on the weekly time frame. Although the daily moving averages show a mildly bullish signal, the overall sentiment is tempered by the bearish indicators on the weekly and monthly charts. The stock has underperformed compared to the Sensex over multiple time frames, further reinforcing the bearish sentiment.

Read More

Why is Ingersoll-Rand falling/rising?

04-Dec-2025

As of 04-Dec, Ingersoll-Rand (India) Ltd's stock is rising by 1.17% after a trend reversal, but it has declined 3.08% over the past week and 12.08% year-to-date. Despite the short-term uptick, the stock remains below key moving averages and has seen reduced investor participation, though it has strong long-term fundamentals.

As of 04-Dec, Ingersoll-Rand (India) Ltd's stock price is currently rising, with a change of 42.4 points or 1.17%. This increase comes after a trend reversal, as the stock has gained after seven consecutive days of decline. Despite this recent uptick, the stock has been underperforming in the short term, with a 3.08% decline over the past week and a 12.08% drop year-to-date. <BR><BR>The stock is currently trading below its 5-day, 20-day, 50-day, 100-day, and 200-day moving averages, indicating a bearish trend overall. Additionally, there has been a significant decrease in investor participation, with delivery volume falling by 66.24% compared to the 5-day average. <BR><BR>However, the stock has outperformed its sector by 2.01% today, which may contribute to the current rise in price. The company maintains strong long-term fundamentals, evidenced by an average Return on Equity (ROE) of 31.26% and a healthy operating profit growth rate of 37.16% annually. The low debt-to-equity ratio also supports its financial stability. <BR><BR>In summary, while Ingersoll-Rand's stock is experiencing a short-term rise, it is important to consider the broader context of its recent performance and investor sentiment.

Read More
iScoreScore
Click here to find our call on this stock
Strong Sell
Sell
Hold
Buy
Strong Buy

MarketsMojo — Loved in India, Now Global

The power of Mojo is now in 29 countries. Explore global equities with the same cutting-edge features you love.

Dashboard
1

Strong Long Term Fundamental Strength with an average Return on Equity (ROE) of 31.26%

  • Healthy long term growth as Operating profit has grown by an annual rate 37.16%
  • Company has a low Debt to Equity ratio (avg) at 0 times
2

Flat results in Sep 25

3

With ROE of 40.7, it has a Very Expensive valuation with a 17.7 Price to Book Value

4

Majority shareholders : Promoters
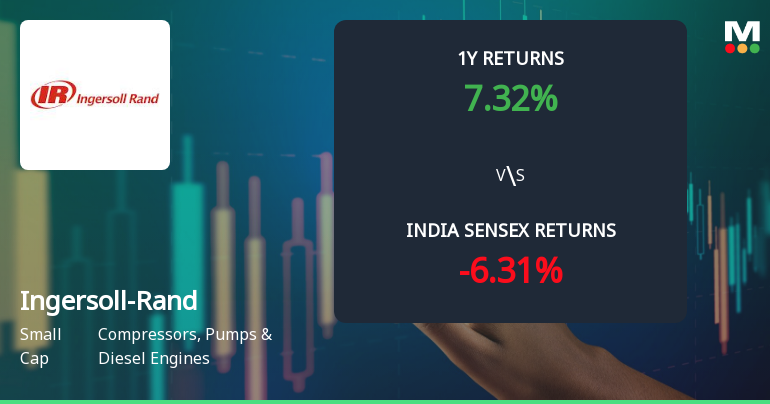
 
5

Underperformed the market in the last 1 year

stock-summaryMojo Parameters
Mojo Parameters
Loading Valuation Snapshot...
Stock DNA
stock-summary
Industry

Compressors, Pumps & Diesel Engines

stock-summary
Market cap

INR 11,531 Cr (Small Cap)

stock-summary
P/E

43.00

stock-summary
Industry P/E

34

stock-summary
Dividend Yield

2.18%

stock-summary
Debt Equity

-0.33

stock-summary
Return on Equity

40.71%

stock-summary
Price to Book

17.82

Revenue and Profits:
Net Sales:
322 Cr
(Quarterly Results - Sep 2025)
Net Profit:
60 Cr
stock-summaryTotal Returns
Total Returns (Price + Dividend) stock-summary
Dividend Yield (2.18%)
TimePeriod
Price Return
Dividend Return
Total Return
3 Months
-4.4%
1.44%
-2.96%
6 Months
-3.73%
2.10%
-1.63%
1 Year
-19.03%
1.77%
-17.26%
2 Years
19.61%
4.87%
24.48%
3 Years
70.97%
12.45%
83.42%
4 Years
203.28%
22.89%
226.17%
5 Years
471.54%
41.59%
513.13%

Latest dividend: 55 per share ex-dividend date: Nov-25-2025

Risk Adjusted Returns v/s stock-summary
Returns Beta
Icon
Beta has not been calculated since enough price history is not available
stock-summaryNews & Corporate Actions
News
Announcements stock-summary

Ingersoll Rand (India) Limited - Disclosure under SEBI Takeover Regulations

22-Nov-2019 | Source : NSE

Disclosure under SEBI Takeover Regulations INGERRAND : Ingersoll- Rand Industrial U.S. INC has submitted to the Exchange, vide letter dated November 21, 2019 a copy of disclosure under Regulation 10(6) in respect of acquisition under Regulation 10 of SEBI (Substantial Acquisition of Shares & Takeovers) Regulations, 2011.

Ingersoll Rand (India) Limited - Dividend

06-Nov-2019 | Source : NSE

Ingersoll Rand (India) Limited has informed the Exchange that the Board of Directors at its meeting held on November 05, 2019 has declared an interim dividend of Rs 3/- per equity share of face value of Rs 10/- each for the financial year ending on March 31, 2020.

Ingersoll Rand (India) Limited - Appointment

05-Nov-2019 | Source : NSE

Ingersoll Rand (India) Limited has informed the Exchange regarding Appointment of Ms Preeti Mohanty as Chief Financial Officer of the company w.e.f. November 05, 2019.

Corporate Actions stock-summary
stock-summary
BOARD MEETING

No Upcoming Board Meetings

stock-summary
DIVIDEND

Ingersoll-Rand (India) Ltd has declared 550% dividend, ex-date: 25 Nov 25

stock-summary
SPLITS

No Splits history available

stock-summary
BONUS

No Bonus history available

stock-summary
RIGHTS

No Rights history available

stock-summaryKey Factors
Quality key factors stock-summary
Factor
Value
Sales Growth (5y)
18.13%
EBIT Growth (5y)
37.16%
EBIT to Interest (avg)
100.00
Debt to EBITDA (avg)
Net Debt is too low
Net Debt to Equity (avg)
-0.33
Sales to Capital Employed (avg)
1.85
Tax Ratio
25.77%
Dividend Payout Ratio
99.37%
Pledged Shares
0
Institutional Holding
9.50%
ROCE (avg)
68.62%
ROE (avg)
31.26%
Valuation key factors
Factor
Value
P/E Ratio
43
Industry P/E
34
Price to Book Value
17.66
EV to EBIT
35.15
EV to EBITDA
33.54
EV to Capital Employed
25.68
EV to Sales
8.40
PEG Ratio
4.45
Dividend Yield
2.20%
ROCE (Latest)
73.07%
ROE (Latest)
40.71%
Technicals key factors
Indicator
Weekly
Monthly
MACD
Bearish
Mildly Bearish
RSI
No Signal
No Signal
Bollinger Bands
Bearish
Bearish
Moving Averages
Mildly Bullish (Daily)
KST
Mildly Bearish
Mildly Bearish
Dow Theory
Mildly Bearish
Mildly Bearish
OBV
Mildly Bearish
Mildly Bearish
stock-summary Technical Indicator Scale: Bearish, Mildly Bearish, Sideways, Mildly Bullish, Bullish  Turned 
stock-summaryShareholding
Shareholding Snapshot : Sep 2025stock-summary
Shareholding Compare (%holding) stock-summary
Majority shareholders

Promoters

Pledged Promoter Holdings

None

Mutual Funds

Held by 14 Schemes (7.91%)

FIIs

Held by 82 FIIs (1.31%)

Promoter with highest holding

Ingersoll-rand Industrial U S Inc (74.0%)

Highest Public shareholder

Icici Prudential Infrastructure Fund (3.82%)

Individual Investors Holdings

12.62%

stock-summaryFinancial
[
  {
    "link": "quarterly",
    "btn_text": "All Quarterly Results",
    "header": "Quarterly Results Snapshot (Standalone) - Sep'25 - YoY",
    "rhs": [
      {
        "prefix": "Net Sales ",
        "suffix": "YoY Growth in quarter ended Sep 2025 is -0.05% vs 16.57% in Sep 2024",
        "dir": -1
      },
      {
        "prefix": "Standalone Net Profit ",
        "suffix": "YoY Growth in quarter ended Sep 2025 is 0.00% vs 21.40% in Sep 2024",
        "dir": -1
      }
    ],
    "table": {
      "header": [
        "Sep'25",
        "Sep'24",
        "Change(%)"
      ],
      "body": [
        {
          "field": "Net Sales",
          "val1": "321.94",
          "val2": "322.10",
          "chgp": "-0.05%",
          "chgp_class": "negative"
        },
        {
          "field": "Operating Profit (PBDIT) excl Other Income",
          "val1": "75.85",
          "val2": "79.23",
          "chgp": "-4.27%",
          "chgp_class": "negative"
        },
        {
          "field": "Interest",
          "val1": "0.41",
          "val2": "0.03",
          "chgp": "1,266.67%",
          "chgp_class": "negative"
        },
        {
          "field": "Exceptional Items",
          "val1": "0.00",
          "val2": "0.00",
          "chgp": "",
          "chgp_class": "neutral"
        },
        {
          "field": "Standalone Net Profit",
          "val1": "60.35",
          "val2": "60.35",
          "chgp": "",
          "chgp_class": "neutral"
        },
        {
          "field": "Operating Profit Margin (Excl OI)",
          "val1": "23.56%",
          "val2": "24.60%",
          "chgp": "-1.04%",
          "chgp_class": "negative"
        }
      ]
    }
  },
  {
    "link": "half-yearly",
    "btn_text": "All Half Yearly Results",
    "header": "Half Yearly Results Snapshot (Standalone) - Sep'25",
    "rhs": [
      {
        "prefix": "Net Sales ",
        "suffix": " Growth in half year ended Sep 2025 is -0.40% vs 10.16% in Sep 2024",
        "dir": -1
      },
      {
        "prefix": "Standalone Net Profit ",
        "suffix": " Growth in half year ended Sep 2025 is -2.36% vs 18.15% in Sep 2024",
        "dir": -1
      }
    ],
    "table": {
      "header": [
        "Sep'25",
        "Sep'24",
        "Change(%)"
      ],
      "body": [
        {
          "field": "Net Sales",
          "val1": "637.26",
          "val2": "639.84",
          "chgp": "-0.40%",
          "chgp_class": "negative"
        },
        {
          "field": "Operating Profit (PBDIT) excl Other Income",
          "val1": "150.09",
          "val2": "162.05",
          "chgp": "-7.38%",
          "chgp_class": "negative"
        },
        {
          "field": "Interest",
          "val1": "0.85",
          "val2": "0.21",
          "chgp": "304.76%",
          "chgp_class": "negative"
        },
        {
          "field": "Exceptional Items",
          "val1": "0.00",
          "val2": "0.00",
          "chgp": "",
          "chgp_class": "neutral"
        },
        {
          "field": "Standalone Net Profit",
          "val1": "119.33",
          "val2": "122.21",
          "chgp": "-2.36%",
          "chgp_class": "negative"
        },
        {
          "field": "Operating Profit Margin (Excl OI)",
          "val1": "23.55%",
          "val2": "25.33%",
          "chgp": "-1.78%",
          "chgp_class": "negative"
        }
      ]
    }
  },
  {
    "link": "nine-monthly",
    "btn_text": "All Nine Monthly Results",
    "header": "Nine Monthly Results Snapshot (Standalone) - Dec'24",
    "rhs": [
      {
        "prefix": "Net Sales ",
        "suffix": "YoY Growth in nine months ended Dec 2024 is 12.23% vs 7.52% in Dec 2023",
        "dir": 1
      },
      {
        "prefix": "Standalone Net Profit ",
        "suffix": "YoY Growth in nine months ended Dec 2024 is 26.09% vs 37.21% in Dec 2023",
        "dir": -1
      }
    ],
    "table": {
      "header": [
        "Dec'24",
        "Dec'23",
        "Change(%)"
      ],
      "body": [
        {
          "field": "Net Sales",
          "val1": "1,021.36",
          "val2": "910.05",
          "chgp": "12.23%",
          "chgp_class": "positive"
        },
        {
          "field": "Operating Profit (PBDIT) excl Other Income",
          "val1": "264.44",
          "val2": "211.87",
          "chgp": "24.81%",
          "chgp_class": "positive"
        },
        {
          "field": "Interest",
          "val1": "0.64",
          "val2": "1.46",
          "chgp": "-56.16%",
          "chgp_class": "positive"
        },
        {
          "field": "Exceptional Items",
          "val1": "0.00",
          "val2": "0.00",
          "chgp": "",
          "chgp_class": "neutral"
        },
        {
          "field": "Standalone Net Profit",
          "val1": "199.87",
          "val2": "158.52",
          "chgp": "26.09%",
          "chgp_class": "positive"
        },
        {
          "field": "Operating Profit Margin (Excl OI)",
          "val1": "25.89%",
          "val2": "23.28%",
          "chgp": "2.61%",
          "chgp_class": "positive"
        }
      ]
    }
  },
  {
    "link": "annual",
    "btn_text": "All Annual Results",
    "header": "Annual Results Snapshot (Standalone) - Mar'25",
    "rhs": [
      {
        "prefix": "Net Sales ",
        "suffix": "YoY Growth in year ended Mar 2025 is 11.53% vs 4.11% in Mar 2024",
        "dir": 1
      },
      {
        "prefix": "Standalone Net Profit ",
        "suffix": "YoY Growth in year ended Mar 2025 is 20.30% vs 21.76% in Mar 2024",
        "dir": -1
      }
    ],
    "table": {
      "header": [
        "Mar'25",
        "Mar'24",
        "Change(%)"
      ],
      "body": [
        {
          "field": "Net Sales",
          "val1": "1,336.29",
          "val2": "1,198.14",
          "chgp": "11.53%",
          "chgp_class": "positive"
        },
        {
          "field": "Operating Profit (PBDIT) excl Other Income",
          "val1": "340.49",
          "val2": "274.79",
          "chgp": "23.91%",
          "chgp_class": "positive"
        },
        {
          "field": "Interest",
          "val1": "1.36",
          "val2": "2.07",
          "chgp": "-34.30%",
          "chgp_class": "positive"
        },
        {
          "field": "Exceptional Items",
          "val1": "0.00",
          "val2": "0.00",
          "chgp": "",
          "chgp_class": "neutral"
        },
        {
          "field": "Standalone Net Profit",
          "val1": "267.53",
          "val2": "222.39",
          "chgp": "20.30%",
          "chgp_class": "positive"
        },
        {
          "field": "Operating Profit Margin (Excl OI)",
          "val1": "25.48%",
          "val2": "22.93%",
          "chgp": "2.55%",
          "chgp_class": "positive"
        }
      ]
    }
  }
]
Quarterly Results Snapshot (Standalone) - Sep'25 - YoYstock-summary
Sep'25
Sep'24
Change(%)
Net Sales
321.94
322.10
-0.05%
Operating Profit (PBDIT) excl Other Income
75.85
79.23
-4.27%
Interest
0.41
0.03
1,266.67%
Exceptional Items
0.00
0.00
Standalone Net Profit
60.35
60.35
Operating Profit Margin (Excl OI)
23.56%
24.60%
-1.04%
Values in Rs Cr.
Direction Arrows
Net Sales

YoY Growth in quarter ended Sep 2025 is -0.05% vs 16.57% in Sep 2024

Direction Arrows
Standalone Net Profit

YoY Growth in quarter ended Sep 2025 is 0.00% vs 21.40% in Sep 2024

Half Yearly Results Snapshot (Standalone) - Sep'25stock-summary
Sep'25
Sep'24
Change(%)
Net Sales
637.26
639.84
-0.40%
Operating Profit (PBDIT) excl Other Income
150.09
162.05
-7.38%
Interest
0.85
0.21
304.76%
Exceptional Items
0.00
0.00
Standalone Net Profit
119.33
122.21
-2.36%
Operating Profit Margin (Excl OI)
23.55%
25.33%
-1.78%
Values in Rs Cr.
Direction Arrows
Net Sales

Growth in half year ended Sep 2025 is -0.40% vs 10.16% in Sep 2024

Direction Arrows
Standalone Net Profit

Growth in half year ended Sep 2025 is -2.36% vs 18.15% in Sep 2024

Nine Monthly Results Snapshot (Standalone) - Dec'24stock-summary
Dec'24
Dec'23
Change(%)
Net Sales
1,021.36
910.05
12.23%
Operating Profit (PBDIT) excl Other Income
264.44
211.87
24.81%
Interest
0.64
1.46
-56.16%
Exceptional Items
0.00
0.00
Standalone Net Profit
199.87
158.52
26.09%
Operating Profit Margin (Excl OI)
25.89%
23.28%
2.61%
Values in Rs Cr.
Direction Arrows
Net Sales

YoY Growth in nine months ended Dec 2024 is 12.23% vs 7.52% in Dec 2023

Direction Arrows
Standalone Net Profit

YoY Growth in nine months ended Dec 2024 is 26.09% vs 37.21% in Dec 2023

Annual Results Snapshot (Standalone) - Mar'25stock-summary
Mar'25
Mar'24
Change(%)
Net Sales
1,336.29
1,198.14
11.53%
Operating Profit (PBDIT) excl Other Income
340.49
274.79
23.91%
Interest
1.36
2.07
-34.30%
Exceptional Items
0.00
0.00
Standalone Net Profit
267.53
222.39
20.30%
Operating Profit Margin (Excl OI)
25.48%
22.93%
2.55%
Values in Rs Cr.
Direction Arrows
Net Sales

YoY Growth in year ended Mar 2025 is 11.53% vs 4.11% in Mar 2024

Direction Arrows
Standalone Net Profit

YoY Growth in year ended Mar 2025 is 20.30% vs 21.76% in Mar 2024

stock-summaryCompany CV
About Ingersoll-Rand (India) Ltd stock-summary
stock-summary
Ingersoll-Rand (India) Ltd
Small Cap
Compressors, Pumps & Diesel Engines
Ingersoll-Rand India Ltd is a leading innovation and solutions provider with powerful brands and leading positions within their market. The Company has a solar manufacturing plant is located at Naroda, Ahmedabad. It is engaged in manufacturing and selling of industrial air compressors of various capacities and providing related services. The Company sells air compressors primarily in India and exports the products to American, Asian and European countries. It focus on Air Solution Segment.
Company Coordinates stock-summary
Company Details
First Floor Subramanya Arcade, No 12/1 Bannerghatta Road Bangalore Karnataka : 560029
stock-summary
Tel: 91-80-46855100
stock-summary
p_r_shubhakar@irco.com
Registrar Details
TSR Darashaw Ltd, 6-10 , Haji Moosa Patrawala Indl. Est , 20 Dr.E.Moses Road , Mahalaxmi , Mumbai