
Compare Shakti Pumps with Similar Stocks
Dashboard
The company has declared negative results for the last 3 consecutive quarters
- The company has declared negative results in Sep 25 after 7 consecutive negative quarters
- INTEREST(Latest six months) At Rs 36.01 cr has Grown at 56.16%
- PBT LESS OI(Q) At Rs 56.51 cr has Fallen at -61.24%
- PAT(Q) At Rs 38.33 cr has Fallen at -65.2%
Falling Participation by Institutional Investors
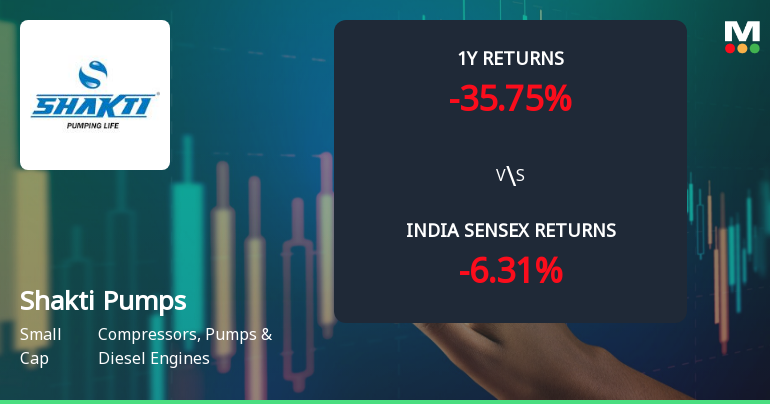
Underperformed the market in the last 1 year
Stock DNA
Compressors, Pumps & Diesel Engines
INR 7,119 Cr (Small Cap)
27.00
35
0.18%
-0.11
15.10%
4.10
Total Returns (Price + Dividend) 
Latest dividend: 1 per share ex-dividend date: Sep-18-2025
Risk Adjusted Returns v/s
Returns Beta

News
Shakti Pumps (India) Ltd Technical Momentum Shifts Amid Mixed Market Signals
Shakti Pumps (India) Ltd, a small-cap player in the Compressors, Pumps & Diesel Engines sector, has experienced a notable shift in its technical momentum, moving from a mildly bearish stance to a sideways trend. Despite a recent downgrade in its Mojo Grade from Hold to Sell, the stock’s technical indicators present a complex picture, with mixed signals across key metrics such as MACD, RSI, Bollinger Bands, and moving averages. This article analyses these technical parameters in detail, providing investors with a comprehensive view of the stock’s current market positioning and momentum.
Read full news article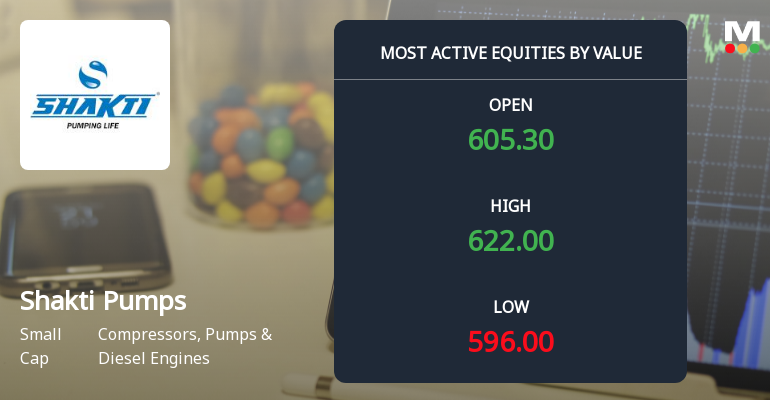
Shakti Pumps Surges on Heavy Value Trading Amid Institutional Interest
Shakti Pumps (India) Ltd witnessed a remarkable surge in trading activity on 6 July 2026, emerging as one of the most actively traded stocks by value in the Compressors, Pumps & Diesel Engines sector. The stock outperformed its sector peers and broader market indices, buoyed by strong institutional interest and a significant uptick in order flow, despite a recent downgrade in its Mojo Grade to Sell.
Read full news article
Announcements
Shakti Pumps (India) Limited - Outcome of Board Meeting
14-Nov-2019 | Source : NSEShakti Pumps (India) Limited has informed the Exchange regarding Board meeting held on November 14, 2019.
Shakti Pumps (India) Limited - Updates
13-Nov-2019 | Source : NSEShakti Pumps (India) Limited has informed the Exchange regarding 'Conference call to be organized on Friday 15th November 2019 at 02:00 P.M. IST. on financial results for the quarter and half year ended 30th September 2019. '.
Updates
04-Sep-2019 | Source : NSE
| Shakti Pumps (India) Limited has informed the Exchange regarding 'Pursuant to Regulation 30 of SEBI (Listing Obligation and Disclosure Requirement) Regulations 2015 Please find enclosed herewith the copy of Notice published on 04th September 2019 in Economic Times, (in English) and Business Standard, (in Hindi) informing about the 24th Annual General Meeting scheduled to be held on Friday, 27th September 2019.'. |
Corporate Actions

No Upcoming Board Meetings

Shakti Pumps (India) Ltd has declared 10% dividend, ex-date: 29 Jul 26

No Splits history available

Shakti Pumps (India) Ltd has announced 5:1 bonus issue, ex-date: 25 Nov 24

No Rights history available
Quality key factors
Valuation key factors
Technicals key factors
 Technical Indicator Scale: Bearish, Mildly Bearish, Sideways, Mildly Bullish, Bullish Turned
 Shareholding Snapshot : Mar 2026
Shareholding Compare (%holding)
Promoters
None
Held by 8 Schemes (4.92%)
Held by 84 FIIs (4.83%)
Shakti Sons Trust (18.35%)
Lic Mutual Fund (3.23%)
33.81%
Quarterly Results Snapshot (Consolidated) - Mar'26 - YoY

YoY Growth in quarter ended Mar 2026 is 28.93% vs 9.20% in Mar 2025

YoY Growth in quarter ended Mar 2026 is -65.23% vs 22.93% in Mar 2025
Half Yearly Results Snapshot (Consolidated) - Sep'25
Growth in half year ended Sep 2025 is 7.21% vs 352.21% in Sep 2024
Growth in half year ended Sep 2025 is -3.37% vs 2,733.28% in Sep 2024
Nine Monthly Results Snapshot (Consolidated) - Dec'25
YoY Growth in nine months ended Dec 2025 is -0.60% vs 143.08% in Dec 2024
YoY Growth in nine months ended Dec 2025 is -26.46% vs 472.89% in Dec 2024
Annual Results Snapshot (Consolidated) - Mar'26
YoY Growth in year ended Mar 2026 is 7.21% vs 83.57% in Mar 2025
YoY Growth in year ended Mar 2026 is -36.92% vs 188.13% in Mar 2025
About Shakti Pumps (India) Ltd

Company Coordinates


