
Compare SP Apparels with Similar Stocks
Dashboard
Strong ability to service debt as the company has a low Debt to EBITDA ratio of 1.83 times
- PAT(Q) At Rs 18.48 cr has Fallen at -39.2%
- NET SALES(Q) Lowest at Rs 364.91 cr
- PBDIT(Q) Lowest at Rs 44.64 cr.
With ROCE of 14, it has a Attractive valuation with a 1.9 Enterprise value to Capital Employed
Falling Participation by Institutional Investors
Underperformed the market in the last 1 year
Stock DNA
Garments & Apparels
INR 1,906 Cr (Small Cap)
17.00
23
0.25%
0.40
12.32%
2.20
Total Returns (Price + Dividend) 
Latest dividend: 2 per share ex-dividend date: Aug-25-2025
Risk Adjusted Returns v/s
Returns Beta

News
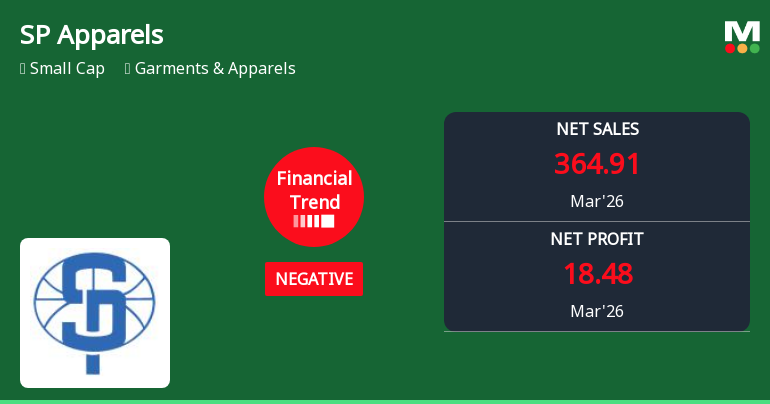
SP Apparels Ltd. Reports Sharp Decline in Quarterly Financial Performance Amid Market Volatility
SP Apparels Ltd., a small-cap player in the Garments & Apparels sector, has reported a significant downturn in its financial performance for the quarter ended March 2026. Key metrics such as net sales, profit after tax, and operating margins have all contracted sharply, signalling a reversal from the positive trends observed in previous quarters. This shift has prompted a downgrade in the company’s Mojo Grade from Buy to Hold, reflecting growing investor caution amid challenging market conditions.
Read full news article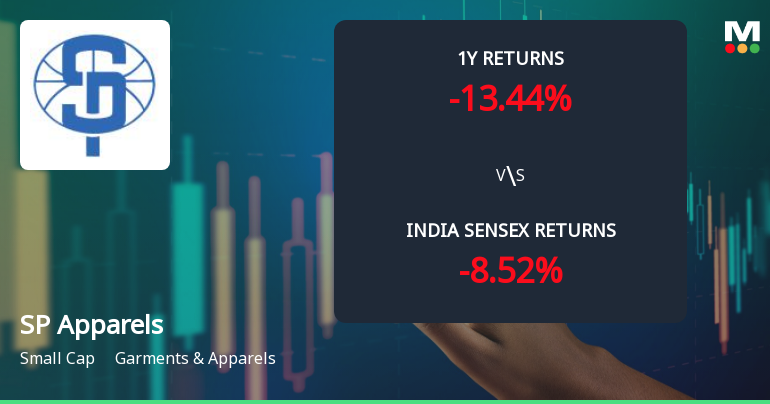
SP Apparels Ltd. Technical Momentum Shifts Amid Mixed Indicator Signals
SP Apparels Ltd., a small-cap player in the Garments & Apparels sector, has recently experienced a nuanced shift in its technical momentum, reflecting a complex interplay of bullish and bearish signals across multiple timeframes. Despite a modest day decline of 0.63%, the stock’s technical parameters reveal a transition from a strongly bullish stance to a more mildly bullish outlook, prompting a reassessment of its near-term price trajectory.
Read full news article
SP Apparels Ltd. Upgraded to Buy on Strong Technical and Financial Performance
SP Apparels Ltd., a small-cap player in the Garments & Apparels sector, has seen its investment rating upgraded from Hold to Buy by MarketsMOJO as of 11 May 2026. This upgrade reflects a marked improvement across key parameters including technical indicators, valuation metrics, financial trends, and overall quality assessment, signalling renewed investor confidence in the company’s prospects.
Read full news article Announcements
S. P. Apparels Limited - Press Release
18-Nov-2019 | Source : NSES. P. Apparels Limited has informed the Exchange regarding a press release dated November 15, 2019, titled "Extract of Unaudited Consolidated Financial Result".
S. P. Apparels Limited - Outcome of Board Meeting
15-Nov-2019 | Source : NSES. P. Apparels Limited has informed the Exchange regarding Board meeting held on November 14, 2019.
S. P. Apparels Limited - Analysts/Institutional Investor Meet/Con. Call Updates
13-Nov-2019 | Source : NSES. P. Apparels Limited has informed the Exchange regarding Analysts/Institutional Investor Meet/Con. Call Updates
Corporate Actions

No Upcoming Board Meetings

SP Apparels Ltd. has declared 20% dividend, ex-date: 25 Aug 25

No Splits history available

No Bonus history available

No Rights history available
Quality key factors
Valuation key factors
Technicals key factors
 Technical Indicator Scale: Bearish, Mildly Bearish, Sideways, Mildly Bullish, Bullish Turned
 Shareholding Snapshot : Mar 2026
Shareholding Compare (%holding)
Promoters
None
Held by 5 Schemes (15.07%)
Held by 46 FIIs (1.48%)
Perumal Sundararajan (49.97%)
Dsp Small Cap Fund (7.7%)
14.35%
Quarterly Results Snapshot (Consolidated) - Mar'26 - YoY

YoY Growth in quarter ended Mar 2026 is -8.59% vs 35.27% in Mar 2025
YoY Growth in quarter ended Mar 2026 is -39.23% vs 6.78% in Mar 2025
Half Yearly Results Snapshot (Consolidated) - Sep'25

Growth in half year ended Sep 2025 is 30.50% vs 17.87% in Sep 2024
Growth in half year ended Sep 2025 is 38.49% vs -8.15% in Sep 2024
Nine Monthly Results Snapshot (Consolidated) - Dec'25
YoY Growth in nine months ended Dec 2025 is 21.87% vs 25.71% in Dec 2024
YoY Growth in nine months ended Dec 2025 is 28.32% vs 4.89% in Dec 2024
Annual Results Snapshot (Consolidated) - Mar'26
YoY Growth in year ended Mar 2026 is 13.15% vs 28.30% in Mar 2025
YoY Growth in year ended Mar 2026 is 5.98% vs 6.10% in Mar 2025
About SP Apparels Ltd.

Company Coordinates


