
Compare Nitiraj Engineer with Similar Stocks
Dashboard
Poor long term growth as Net Sales has grown by an annual rate of -3.60% and Operating profit at -64.36% over the last 5 years
The company has declared negative results for the last 2 consecutive quarters
With ROE of 1.3, it has a Very Expensive valuation with a 2.3 Price to Book Value
Below par performance in long term as well as near term
Stock DNA
Industrial Manufacturing
INR 199 Cr (Micro Cap)
NA (Loss Making)
39
0.79%
-0.10
1.26%
2.33
Total Returns (Price + Dividend) 
Latest dividend: 1.5 per share ex-dividend date: Sep-16-2025
Risk Adjusted Returns v/s
Returns Beta

News

Nitiraj Engineers Ltd is Rated Sell
Nitiraj Engineers Ltd is rated Sell by MarketsMOJO, with this rating last updated on 18 June 2026. While the rating was revised on that date, the analysis and financial metrics discussed here reflect the stock’s current position as of 23 June 2026, providing investors with an up-to-date view of the company’s fundamentals, valuation, financial trends, and technical outlook.
Read full news article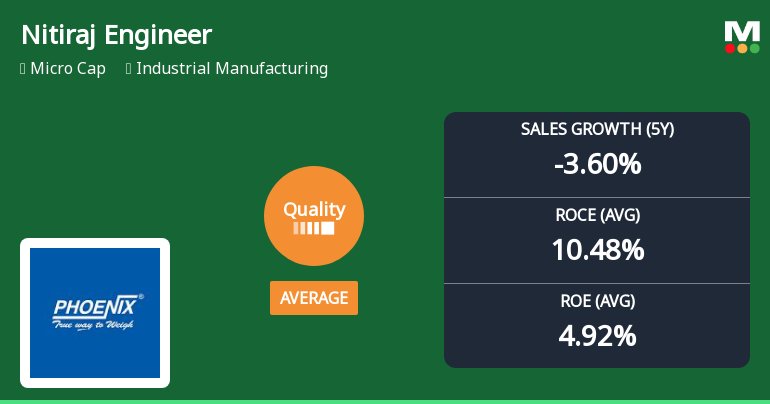
Nitiraj Engineers Ltd Quality Grade Upgrade: A Detailed Analysis of Business Fundamentals
Nitiraj Engineers Ltd, a micro-cap player in the industrial manufacturing sector, has seen its quality grade upgraded from below average to average as of 16 Feb 2026. Despite this improvement, the company’s fundamentals present a nuanced picture with some key metrics showing deterioration while others have stabilised or improved modestly. This article analyses the changes in Nitiraj Engineers’ business quality parameters, including profitability, leverage, and operational efficiency, to provide investors with a comprehensive view of the company’s current standing.
Read full news article
Nitiraj Engineers Ltd is Rated Strong Sell
Nitiraj Engineers Ltd is rated Strong Sell by MarketsMOJO, with this rating last updated on 16 Feb 2026. However, the analysis and financial metrics discussed here reflect the stock’s current position as of 12 June 2026, providing investors with the latest insights into the company’s performance and outlook.
Read full news article Announcements
Nitiraj Engineers Limited - Clarification - Financial Results
09-Dec-2019 | Source : NSENitiraj Engineers Limitedeers Limited for the quarter ended 30-Sep-2019 with respect to Regulation 33 of the SEBI (Listing Obligations and Disclosure Requirements) Regulations, 2015.
Nitiraj Engineers Limited - Investor Presentation
05-Dec-2019 | Source : NSENitiraj Engineers Limited has informed the Exchange regarding Investor Presentation
Nitiraj Engineers Limited - Investor Presentation
21-Nov-2019 | Source : NSENitiraj Engineers Limited has informed the Exchange regarding Investor Presentation
Corporate Actions

No Upcoming Board Meetings

Nitiraj Engineers Ltd has declared 15% dividend, ex-date: 16 Sep 25

No Splits history available

Nitiraj Engineers Ltd has announced 1:4 bonus issue, ex-date: 30 Sep 19

No Rights history available
Quality key factors
Valuation key factors
Technicals key factors
 Technical Indicator Scale: Bearish, Mildly Bearish, Sideways, Mildly Bullish, Bullish Turned
 Shareholding Snapshot : Mar 2026
Shareholding Compare (%holding)
Promoters
None
Held by 0 Schemes
Held by 0 FIIs
Rajesh Raghunath Bhatwal (44.91%)
Yi Hung Sin (7.98%)
17.16%
Quarterly Results Snapshot (Standalone) - Mar'26 - YoY

YoY Growth in quarter ended Mar 2026 is -63.82% vs -57.00% in Mar 2025
YoY Growth in quarter ended Mar 2026 is -966.67% vs -100.81% in Mar 2025
Half Yearly Results Snapshot (Standalone) - Sep'25

Growth in half year ended Sep 2025 is 60.01% vs -39.04% in Sep 2024
Growth in half year ended Sep 2025 is 179.75% vs -165.73% in Sep 2024
Nine Monthly Results Snapshot (Standalone) - Dec'25
YoY Growth in nine months ended Dec 2025 is -29.07% vs 12.64% in Dec 2024
YoY Growth in nine months ended Dec 2025 is -65.37% vs 5.63% in Dec 2024
Annual Results Snapshot (Standalone) - Mar'26
YoY Growth in year ended Mar 2026 is -39.35% vs -23.82% in Mar 2025
YoY Growth in year ended Mar 2026 is -78.05% vs -59.88% in Mar 2025
About Nitiraj Engineers Ltd

Company Coordinates


