
Compare M.V.K. Agro with Similar Stocks
Dashboard
Poor Management Efficiency with a low ROCE of 8.66%
- The company has been able to generate a Return on Capital Employed (avg) of 8.66% signifying low profitability per unit of total capital (equity and debt)
Low ability to service debt as the company has a high Debt to EBITDA ratio of 5.29 times
Flat results in Mar 26
With ROCE of 7.1, it has a Very Expensive valuation with a 3.2 Enterprise value to Capital Employed
Despite the size of the company, domestic mutual funds hold only 0% of the company
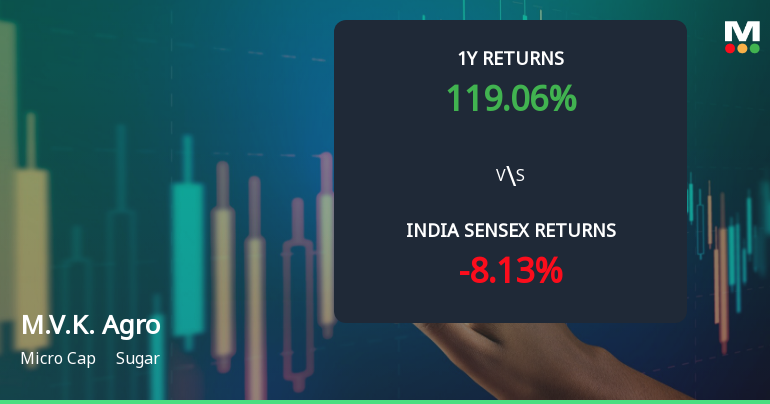
Total Returns (Price + Dividend) 
M.V.K. Agro for the last several years.
Risk Adjusted Returns v/s
Returns Beta

News
M.V.K. Agro Food Product Ltd Technical Analysis: Momentum Shifts Amid Bearish Signals
M.V.K. Agro Food Product Ltd, a micro-cap player in the sugar sector, has experienced a notable shift in its technical momentum, moving from a mildly bearish to a more pronounced bearish trend. Despite a 4.01% rise in the latest session, key technical indicators such as MACD, moving averages, and Bollinger Bands reveal a complex picture that suggests caution for investors amid ongoing volatility.
Read full news article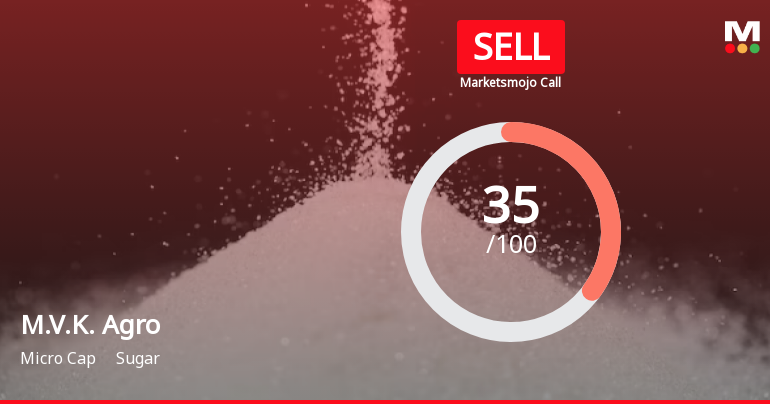
M.V.K. Agro Food Product Ltd is Rated Sell
M.V.K. Agro Food Product Ltd is rated 'Sell' by MarketsMOJO, with this rating last updated on 02 June 2026. However, the analysis and financial metrics presented here reflect the stock’s current position as of 05 July 2026, providing investors with the most recent and relevant data to assess the company’s outlook.
Read full news article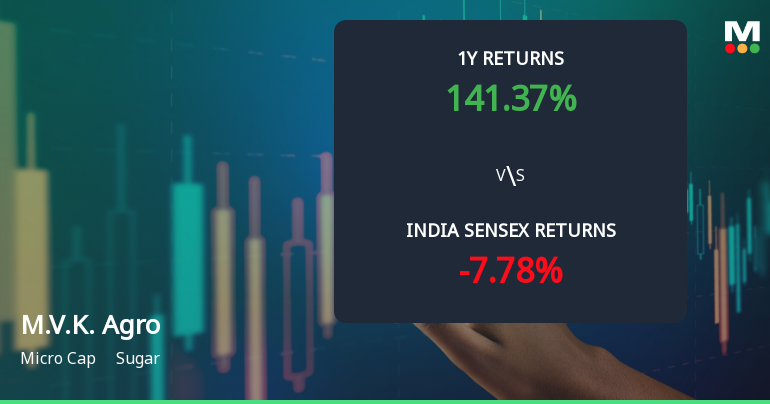
M.V.K. Agro Food Product Ltd Sees Technical Momentum Shift Amid Mixed Indicators
M.V.K. Agro Food Product Ltd, a micro-cap player in the sugar sector, has experienced a subtle shift in its technical momentum, moving from a bearish to a mildly bearish trend. Despite a notable day gain of 5.96%, the stock remains under pressure with mixed signals from key technical indicators such as MACD, RSI, Bollinger Bands, and moving averages, reflecting ongoing volatility and uncertainty in price action.
Read full news article Announcements
Corporate Actions

No Upcoming Board Meetings

No Dividend history available

No Splits history available

No Bonus history available

No Rights history available
Quality key factors
Valuation key factors
Technicals key factors
 Technical Indicator Scale: Bearish, Mildly Bearish, Sideways, Mildly Bullish, Bullish Turned
 Shareholding Snapshot : Mar 2026
Shareholding Compare (%holding)
Promoters
None
Held by 0 Schemes
Held by 2 FIIs (0.04%)
Marotrao Vyankatrao Kawale (35.47%)
Kamya Abhishek Kamdar (3.89%)
37.88%
Quarterly Results Snapshot (Standalone) - Mar'26 - QoQ

QoQ Growth in quarter ended Mar 2026 is 59.41% vs 222.30% in Dec 2025
QoQ Growth in quarter ended Mar 2026 is 64.45% vs 162.12% in Dec 2025
Half Yearly Results Snapshot (Consolidated) - Sep'25
Growth in half year ended Sep 2025 is -44.78% vs 65.95% in Mar 2025
Growth in half year ended Sep 2025 is -21.42% vs 53.12% in Mar 2025
Nine Monthly Results Snapshot (Consolidated) - Dec'25
YoY Growth in nine months ended Dec 2025 is -14.02% vs -1.97% in Mar 2026
YoY Growth in nine months ended Dec 2025 is -57.33% vs -1.75% in Mar 2026
Annual Results Snapshot (Consolidated) - Mar'26

YoY Growth in year ended Mar 2026 is 113.64% vs 5.86% in Mar 2025
YoY Growth in year ended Mar 2026 is 399.79% vs 7.00% in Mar 2025
About M.V.K. Agro Food Product Ltd

Company Coordinates


