
Compare 5Paisa Capital with Similar Stocks
Stock DNA
Capital Markets
INR 1,583 Cr (Micro Cap)
36.00
21
0.00%
0.58
6.81%
2.44
Total Returns (Price + Dividend) 
5Paisa Capital for the last several years.
Risk Adjusted Returns v/s
Returns Beta

News

5Paisa Capital Ltd Upgraded to Sell by MarketsMOJO Amid Mixed Technical and Financial Signals
5Paisa Capital Ltd, a micro-cap player in the capital markets sector, has seen its investment rating upgraded from Strong Sell to Sell as of 22 June 2026. This change reflects a nuanced shift in the company’s technical outlook despite persistent challenges in its financial performance and valuation metrics. The upgrade is primarily driven by improvements in technical indicators, while fundamental concerns continue to weigh on the stock’s long-term prospects.
Read full news article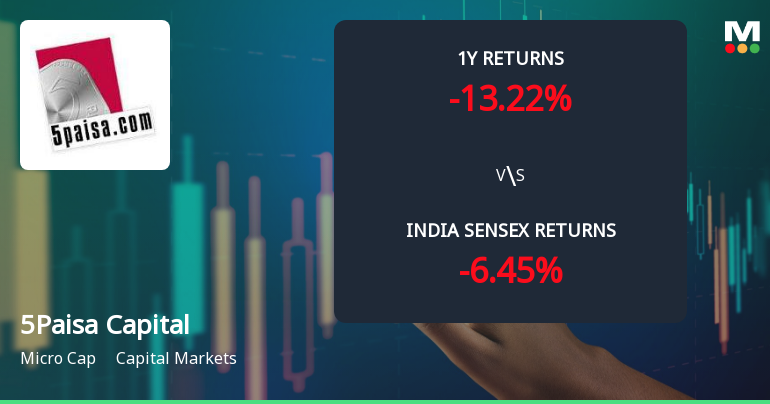
5Paisa Capital Ltd Technical Momentum Shifts Amid Mixed Market Signals
5Paisa Capital Ltd has exhibited a notable shift in its technical momentum, moving from a mildly bearish stance to a sideways trend as of late June 2026. Despite a recent upgrade from a Strong Sell to a Sell rating by MarketsMOJO, the micro-cap stock continues to face mixed signals from key technical indicators, reflecting a complex outlook for investors in the capital markets sector.
Read full news article
5Paisa Capital Ltd is Rated Strong Sell
5Paisa Capital Ltd is rated Strong Sell by MarketsMOJO, with this rating last updated on 27 January 2026. However, all fundamentals, returns, and financial metrics discussed here reflect the stock’s current position as of 20 June 2026, providing investors with an up-to-date analysis of the company’s standing.
Read full news article Announcements
Cancellation Of Board Meeting
18-Jun-2026 | Source : BSEThe Board Meeting to be held on 18/06/2026 is stand cancelled
Announcement under Regulation 30 (LODR)-Cessation
17-Jun-2026 | Source : BSEIntimation of Resigantion of Mr. Sudhendoo Gandhi from position of Chief Compliance officer with effect from the close of Business hours of June 16 2026
Announcement under Regulation 30 (LODR)-Change in Management
17-Jun-2026 | Source : BSEIntimation of Resignation of Mr. Sudhendoo Ganddhi Chief Compliance Officer of the Company with effect from close of business hour of June 16 2026
Corporate Actions

No Upcoming Board Meetings

No Dividend history available

No Splits history available

No Bonus history available

5Paisa Capital Ltd has announced 1:2 rights issue, ex-date: 17 Mar 26
Quality key factors
Valuation key factors
Technicals key factors
 Technical Indicator Scale: Bearish, Mildly Bearish, Sideways, Mildly Bullish, Bullish Turned
 Shareholding Snapshot : Apr 2026
Shareholding Compare (%holding)
Non Institution
None
Held by 0 Schemes
Held by 16 FIIs (15.07%)
Nirmal Bhanwarlal Jain (19.85%)
Fih Mauritius Investments Limited (24.54%)
13.3%
Quarterly Results Snapshot (Consolidated) - Mar'26 - YoY

YoY Growth in quarter ended Mar 2026 is 19.85% vs -36.85% in Mar 2025

YoY Growth in quarter ended Mar 2026 is 7.85% vs 74.22% in Mar 2025
Half Yearly Results Snapshot (Consolidated) - Sep'25
Growth in half year ended Sep 2025 is -23.73% vs 11.89% in Sep 2024
Growth in half year ended Sep 2025 is -49.92% vs 25.04% in Sep 2024
Nine Monthly Results Snapshot (Consolidated) - Dec'25
YoY Growth in nine months ended Dec 2025 is -18.79% vs 2.34% in Dec 2024
YoY Growth in nine months ended Dec 2025 is -42.70% vs 19.52% in Dec 2024
Annual Results Snapshot (Consolidated) - Mar'26
YoY Growth in year ended Mar 2026 is -11.13% vs -8.87% in Mar 2025
YoY Growth in year ended Mar 2026 is -35.23% vs 25.33% in Mar 2025
About 5Paisa Capital Ltd

Company Coordinates


