
Compare Master Trust with Similar Stocks
Dashboard
Strong Long Term Fundamental Strength with an average Return on Equity (ROE) of 18.78%
Healthy long term growth as Operating profit has grown by an annual rate of 30.16%
Positive results in Mar 26
With ROE of 15.4, it has a Very Attractive valuation with a 1.3 Price to Book Value
Despite the size of the company, domestic mutual funds hold only 0% of the company
Underperformed the market in the last 1 year
Stock DNA
Capital Markets
INR 1,093 Cr (Micro Cap)
9.00
22
0.00%
0.28
15.44%
1.35
Total Returns (Price + Dividend) 
Latest dividend: 0.1 per share ex-dividend date: Sep-21-2018
Risk Adjusted Returns v/s
Returns Beta

News

Master Trust Ltd Upgraded to Hold as Technicals Improve and Financials Strengthen
Master Trust Ltd, a micro-cap player in the capital markets sector, has seen its investment rating upgraded from Sell to Hold as of 9 July 2026, reflecting a nuanced improvement across technical indicators, valuation metrics, financial trends, and overall quality. This shift comes amid a strong quarterly performance and evolving market dynamics, signalling cautious optimism among investors and analysts alike.
Read full news article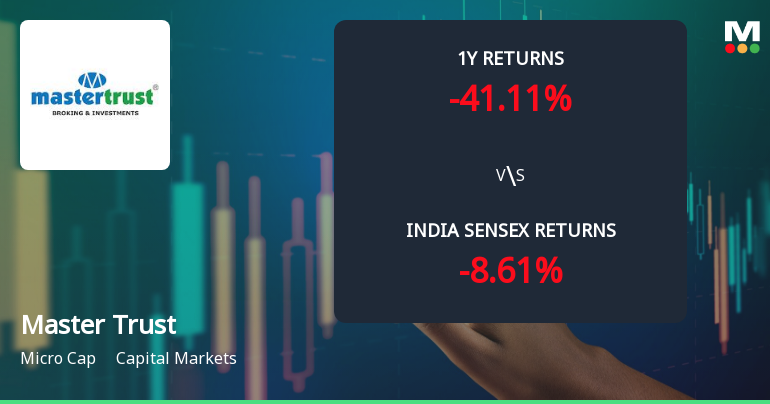
Master Trust Ltd Sees Mixed Technical Signals Amid Price Momentum Shift
Master Trust Ltd, a micro-cap player in the Capital Markets sector, has experienced a notable shift in price momentum and technical indicators, reflecting a complex market stance. Despite a strong intraday rally pushing the stock price to ₹86.82, the overall technical landscape remains mixed, with some indicators signalling mild bullishness while others continue to reflect bearish tendencies.
Read full news article
Master Trust Ltd Downgraded to Sell Amid Technical Weakness and Valuation Concerns
Master Trust Ltd, a micro-cap player in the capital markets sector, has seen its investment rating downgraded from Hold to Sell following a comprehensive reassessment of its quality, valuation, financial trends, and technical indicators. Despite some positive financial results in the recent quarter, the stock’s bearish technical outlook and sustained underperformance relative to benchmarks have prompted this revision.
Read full news article Announcements
Corporate Actions

No Upcoming Board Meetings

Master Trust Ltd has declared 10% dividend, ex-date: 21 Sep 18

Master Trust Ltd has announced 1:5 stock split, ex-date: 30 Oct 24

No Bonus history available

No Rights history available
Quality key factors
Valuation key factors
Technicals key factors
 Technical Indicator Scale: Bearish, Mildly Bearish, Sideways, Mildly Bullish, Bullish Turned
 Shareholding Snapshot : Mar 2026
Shareholding Compare (%holding)
Promoters
16.9516
Held by 0 Schemes
Held by 3 FIIs (0.02%)
Rajinder Kumar Singhania (23.35%)
G S Auto Leasing Limited (10.86%)
9.67%
Quarterly Results Snapshot (Consolidated) - Mar'26 - QoQ

QoQ Growth in quarter ended Mar 2026 is 32.10% vs 7.77% in Dec 2025
QoQ Growth in quarter ended Mar 2026 is 14.40% vs 0.38% in Dec 2025
Half Yearly Results Snapshot (Consolidated) - Sep'25

Growth in half year ended Sep 2025 is -17.68% vs 47.65% in Sep 2024
Growth in half year ended Sep 2025 is -18.21% vs 68.45% in Sep 2024
Nine Monthly Results Snapshot (Consolidated) - Dec'25
YoY Growth in nine months ended Dec 2025 is -14.43% vs 37.33% in Dec 2024
YoY Growth in nine months ended Dec 2025 is -15.62% vs 51.96% in Dec 2024
Annual Results Snapshot (Consolidated) - Mar'26
YoY Growth in year ended Mar 2026 is -1.39% vs 16.66% in Mar 2025
YoY Growth in year ended Mar 2026 is -3.92% vs 21.43% in Mar 2025
About Master Trust Ltd

Company Coordinates


