Accelya Solution

  • Market Cap: Small Cap
  • Industry: Computers - Software & Consulting
  • ISIN: INE793A01012
  • NSEID: ACCELYA
  • BSEID: 532268
INR
1,142.50
-22.3 (-1.91%)
BSENSE

Jul 30, 03:30 PM

BSE+NSE Vol: 10.61 k

  • Price Points
  • Score
  • Mojo Parameters
  • Total Return
  • News and Corporate Actions
  • Key factors
  • Shareholding
  • Financials
  • CompanyCV
stock-summaryPrice Point
High/Low

1Day

52 Week

Valuation
Technical
Day's Volume

CASH

10.61 k (-14.14%) Volume

Shareholding (Jun 2026)

FII

0.11%

Held by 14 FIIs

DII

0.01%

Held by 0 DIIs

Promoter

74.66%

Are Accelya Solutions India Ltd latest results good or bad?

30-Jul-2026

Accelya Solutions India Ltd's latest results show a 42.42% increase in net profit to ₹30.45 crores, driven by improved operating margins of 36.27%. However, revenue declined by 6.56% quarter-on-quarter, raising concerns about demand sustainability in its core aviation software business.

Accelya Solutions India Ltd's latest results present a mixed picture. On the positive side, the company reported a net profit of ₹30.45 crores for Q1 FY27, which is a significant increase of 42.42% compared to the previous quarter. This improvement in profitability is largely attributed to a substantial expansion in operating margins, which rose to 36.27%, indicating enhanced operational efficiency.<BR><BR>However, the revenue figures tell a different story. The company experienced a decline in revenue, with a 6.56% decrease quarter-on-quarter, marking the lowest quarterly revenue in recent history at ₹127.12 crores. Year-on-year, revenue also fell by 3.52%. This decline raises concerns about the sustainability of demand in Accelya's core aviation software business.<BR><BR>Overall, while the profit margins have improved significantly, the revenue decline poses challenges for the company's growth prospects. Investors may need to consider the implications of these contrasting trends when evaluating the company's performance.

View full answer

Should I buy, sell or hold Accelya Solutions India Ltd?

30-Jul-2026

Why is Accelya Solutions India Ltd falling/rising?

30-Jul-2026

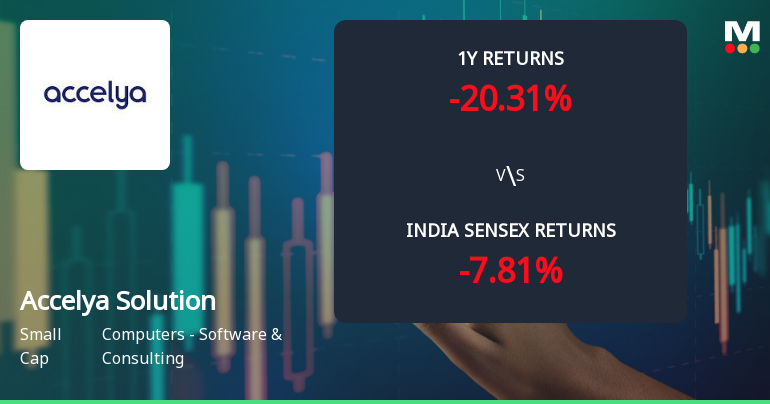
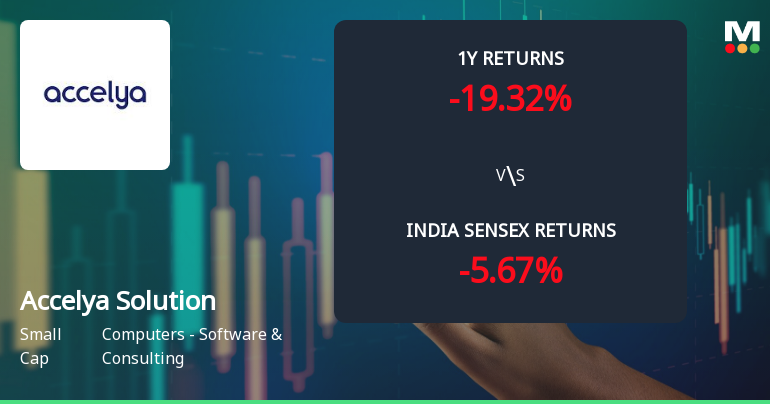
As of 30-Jul, Accelya Solutions India Ltd's stock price is declining, currently at 1,141.25, reflecting a 2.24% decrease. The stock has underperformed significantly over the past year, with a return of -19.29%, and faces negative sentiment due to low net sales and lack of institutional investment.

As of 30-Jul, Accelya Solutions India Ltd's stock price is falling, currently at 1,141.25, which reflects a decrease of 26.1 points or 2.24%. This decline is evident in the stock's performance today, where it underperformed its sector by 1.97% and reached an intraday low of Rs 1137.35, marking a drop of 2.57%. <BR><BR>Over the past year, the stock has generated a return of -19.29%, significantly underperforming the benchmark BSE500, which has only seen a decline of 4.36% during the same period. Additionally, the company's net sales have shown a concerning trend, with a quarterly net sales figure of Rs 127.12 crore being the lowest reported, and a year-to-date profit after tax (PAT) growth of -22.93%. <BR><BR>Despite some positive factors such as a high dividend yield of 7.4% and the company being net-debt free, these have not been sufficient to offset the negative sentiment surrounding the stock. The lack of domestic mutual fund investment, which stands at 0%, suggests that institutional investors may not be confident in the stock's current valuation or business outlook. Furthermore, the stock's consistent underperformance against benchmarks over the last three years, coupled with a flat performance in recent financial results, contributes to the overall bearish sentiment surrounding Accelya Solutions India Ltd.

View full answer

How big is Accelya Solution?

11-Jun-2026

As of 10th June, Accelya Solutions India Ltd has a market capitalization of 1,651.00 Cr, with recent net sales of 536.87 Cr and net profit of 98.88 Cr over the last four quarters.

As of 10th June, <BR><BR>Market Cap: Accelya Solutions India Ltd has a market capitalization of 1,651.00 Cr and is classified as a Small Cap company.<BR><BR>Recent Quarterly Performance: The sum of Net Sales for the latest 4 quarters is 536.87 Cr, while the sum of Net Profit for the same period is 98.88 Cr.<BR><BR>Balance Sheet Snapshot: The reporting period is June 2025, with Shareholder's Funds amounting to 277.68 Cr and Total Assets valued at 436.85 Cr.

View full answer

Who are in the management team of Accelya Solution?

11-Jun-2026

The management team of Accelya Solution includes Gurudas Vasudev Shenoy (Managing Director), James Davidson (Chairman & Independent Director), Ninad Umranikar (Company Secretary & Compliance Officer), and several Independent Directors: Sangeeta Singh, Jose Maria Hurtado, and Saurav Adhikari.

The management team of Accelya Solution includes the following individuals:<BR><BR>1. Ninad Umranikar - Company Secretary & Compliance Officer<BR>2. Sangeeta Singh - Independent Director<BR>3. Jose Maria Hurtado - Director<BR>4. James Davidson - Chairman & Independent Director<BR>5. Saurav Adhikari - Independent Director<BR>6. Gurudas Vasudev Shenoy - Managing Director<BR><BR>If you need more details about any specific member or their roles, feel free to ask!

View full answer

Who are the peers of the Accelya Solution?

11-Jun-2026

Accelya Solution's peers include Ceinsys Tech, Saksoft, Hypersoft Tech, Dynacons Sys, InfoBeans Tech, GHV Infra, IZMO, Magellanic Cloud, and NINtec Systems. In terms of management risk, growth, and capital structure, Accelya is rated average, with its 1-year return of -23.38% outperforming only Magellanic Cloud.

Peers: The peers of Accelya Solution are Ceinsys Tech, Saksoft, Hypersoft Tech., Dynacons Sys., InfoBeans Tech., GHV Infra, IZMO, Magellanic Cloud, and NINtec Systems.<BR><BR>Quality Snapshot: Excellent management risk is observed at Ceinsys Tech, Dynacons Sys., InfoBeans Tech., GHV Infra, Magellanic Cloud, and NINtec Systems, while Average management risk is found at Accelya Solution, Saksoft, and the rest. Below Average management risk is noted at Hypersoft Tech. and IZMO. In terms of Growth, Excellent growth is seen at Ceinsys Tech, Dynacons Sys., GHV Infra, NINtec Systems, and the rest, while Average growth is found at Accelya Solution and Saksoft. Good growth is noted at Hypersoft Tech., InfoBeans Tech., and IZMO, while Below Average growth is observed at Aurum Proptech. For Capital Structure, Excellent capital structure is held by Ceinsys Tech, Saksoft, Hypersoft Tech., InfoBeans Tech., IZMO, and NINtec Systems, while Good capital structure is seen at Dynacons Sys., GHV Infra, Magellanic Cloud, and the rest, and Below Average capital structure is noted at Aurum Proptech.<BR><BR>Return Snapshot: The peer with the highest 1-year return is Hypersoft Tech. at 865.53%, while the lowest is Magellanic Cloud at -70.53%. Accelya Solution's 1-year return of -23.38% is better than Magellanic Cloud's but worse than all other peers. Additionally, the six-month return is negative for Ceinsys Tech, Saksoft, GHV Infra, Magellanic Cloud, and Aurum Proptech.

View full answer

What does Accelya Solution do?

10-Jun-2026

Accelya Solutions India Ltd is a software solutions provider for the global Airline and Travel industry, offering services in the Computers - Software & Consulting sector. As of March 2026, it reported net sales of 136 Cr and a net profit of 21 Cr, with a market cap of INR 1,651 Cr.

Overview:<BR>Accelya Solutions India Ltd is a software solutions provider for the global Airline and Travel industry, operating within the Computers - Software & Consulting sector and classified as a Small Cap company.<BR><BR>History:<BR>Accelya Solutions India Ltd was originally established as Kale Consultants Limited in 1986. The company underwent a name change to Accelya Kale Solutions Limited in 2012 and was rebranded to its current name on February 28, 2019. The latest quarterly results reported net sales and net profit for the period ending March 2026.<BR><BR>Financial Snapshot:<BR>- Net Sales: 136 Cr (Quarterly Results - Mar 2026)<BR>- Net Profit: 21 Cr (Quarterly Results - Mar 2026)<BR>- Market Cap: INR 1,651 Cr (Small Cap)<BR><BR>Key Metrics:<BR>- P/E: 16.00<BR>- Industry P/E: 20<BR>- Dividend Yield: 7.64%<BR>- Debt Equity: -0.12<BR>- Return on Equity: 44.29%<BR>- Price to Book: 6.32<BR><BR>Contact Details:<BR>Address: Accelya Enclave 685/2B&2C 1st, Flr Sharada Arcade Satara Road Pune Maharashtra : 411037<BR>Tel: 91-20-66083777<BR>Email: info@kaleconsultants.com<BR>Website: w3.accelya.com

View full answer

When is the next results date for Accelya Solutions India Ltd?

15-Apr-2026

The next results date for Accelya Solutions India Ltd is April 29, 2026.

The next results date for Accelya Solutions India Ltd is scheduled for April 29, 2026.

View full answer

How has been the historical performance of Accelya Solution?

06-Nov-2025

Accelya Solution has shown consistent growth, with net sales increasing from 368.40 Cr in June 2022 to 528.72 Cr in June 2025, and profit after tax rising to 129.02 Cr. However, cash flow from operations declined to 144.00 Cr in June 2025, indicating some cash management challenges despite strong profitability.

Answer:<BR>The historical performance of Accelya Solution shows a consistent growth in net sales and profit over the years, with net sales reaching 528.72 Cr in June 2025, up from 511.13 Cr in June 2024 and significantly higher than 368.40 Cr in June 2022. The total operating income followed a similar trend, increasing to 528.72 Cr in June 2025 from 469.36 Cr in June 2023. The operating profit (PBDIT) also saw an upward trajectory, reaching 206.06 Cr in June 2025, compared to 202.13 Cr in June 2024 and 142.09 Cr in June 2022. Profit before tax increased to 174.61 Cr in June 2025, up from 136.16 Cr in June 2024, while profit after tax rose to 129.02 Cr from 93.85 Cr in the previous year. The earnings per share (EPS) improved to 86.42 in June 2025 from 62.86 in June 2024, reflecting strong profitability. <BR><BR>In terms of assets and liabilities, total assets increased to 436.85 Cr in June 2025 from 400.53 Cr in June 2024, while total liabilities also rose to 436.85 Cr from 400.53 Cr in the same period. The company's cash flow from operating activities was 144.00 Cr in June 2025, slightly down from 156.00 Cr in June 2024, and the net cash outflow was recorded at -9.00 Cr. Overall, Accelya Solution has demonstrated a solid financial performance with increasing revenues and profits, although it faced a decline in cash flow from operations in the latest year.<BR><BR>Breakdown:<BR>Accelya Solution's financial performance has shown a positive trend over the years, with net sales increasing from 368.40 Cr in June 2022 to 528.72 Cr in June 2025. The total operating income mirrored this growth, reaching 528.72 Cr in June 2025. Operating profit (PBDIT) also rose significantly, from 142.09 Cr in June 2022 to 206.06 Cr in June 2025, indicating improved operational efficiency. Profit before tax increased to 174.61 Cr in June 2025, while profit after tax reached 129.02 Cr, reflecting a strong growth trajectory. The earnings per share rose to 86.42 in June 2025, showcasing enhanced shareholder value. On the balance sheet, total assets grew to 436.85 Cr, with total liabilities matching this figure, indicating a stable financial position. However, cash flow from operating activities decreased to 144.00 Cr in June 2025, highlighting some challenges in cash management despite overall profitability.

View full answer

Is Accelya Solution technically bullish or bearish?

04-Nov-2025

As of November 3, 2025, Accelya Solution's technical trend is mildly bearish, supported by bearish signals from the MACD and Bollinger Bands on both weekly and monthly time frames, despite a mildly bullish daily moving average.

As of 3 November 2025, the technical trend for Accelya Solution has changed from sideways to mildly bearish. The current stance is mildly bearish, driven by the weekly MACD indicating a mildly bearish signal, while the monthly MACD is bearish. Both the weekly and monthly Bollinger Bands confirm a bearish outlook. The Dow Theory also supports this with a mildly bearish stance on both weekly and monthly time frames. Although the daily moving averages show a mildly bullish signal, the overall technical indicators suggest a bearish sentiment prevailing in the longer time frames. The stock has underperformed significantly compared to the Sensex over the past month and year, further reinforcing the bearish outlook.

View full answer

Is Accelya Solution overvalued or undervalued?

10-Oct-2025

As of October 9, 2025, Accelya Solution is considered very attractive and undervalued, with a PE ratio of 17.40, an EV to EBITDA of 11.07, and a PEG ratio of 0.47, indicating strong operational efficiency and profitability compared to peers like TCS and Infosys, despite a recent one-year return of -11.48%.

As of 9 October 2025, the valuation grade for Accelya Solution has moved from attractive to very attractive, indicating a significant positive shift in its perceived value. The company is currently assessed as undervalued. Key ratios supporting this conclusion include a PE ratio of 17.40, an EV to EBITDA of 11.07, and a PEG ratio of 0.47, all of which suggest that the stock is trading at a discount relative to its earnings growth potential.<BR><BR>In comparison to its peers, Accelya Solution's PE ratio is notably lower than TCS, which stands at 22.48, and Infosys at 23. This further emphasizes its undervaluation in the market. Additionally, the company's impressive ROCE of 90.64% and ROE of 46.46% highlight its strong operational efficiency and profitability. Despite a recent underperformance in the one-year period with a return of -11.48% compared to the Sensex's 0.87%, the overall metrics suggest that Accelya Solution presents a compelling investment opportunity at its current price of 1504.40.

View full answer

Who are the top shareholders of the Accelya Solution?

17-Jul-2025

The top shareholder of Accelya Solution is Accelya Holding World S L U, owning 74.66% of the company. Other shareholders include 25 foreign institutional investors with 2.34%, Siddhartha Sacheti with 1.91%, and individual investors holding a total of 17.62%.

The top shareholders of Accelya Solution primarily include its promoters, with Accelya Holding World S L U being the largest shareholder, holding 74.66% of the company. There are also 25 foreign institutional investors (FIIs) who collectively hold 2.34%. The highest public shareholder is Siddhartha Sacheti, who owns 1.91%. Additionally, individual investors hold a combined total of 17.62%. There are no pledged promoter holdings reported.

View full answer

Has Accelya Solution declared dividend?

06-Jun-2025

Yes, Accelya Solutions India Ltd has declared a 500% dividend, amounting to ₹50 per share, with an ex-date of January 30, 2025. Despite recent price declines, the company has shown positive total returns over longer periods.

Accelya Solutions India Ltd has declared a 500% dividend.<BR><BR>Dividend Details:<BR>- Percentage announced: 500%<BR>- Amount per share: 50<BR>- Ex-date: 30 Jan 25<BR><BR>Dividend Yield: 6.46%.<BR><BR>Total Returns by Period:<BR>Over the past 6 months, the price return was -11.86%, the dividend return was 3.18%, resulting in a total return of -8.68%.<BR><BR>In the 1-year period, the price return was -13.85%, the dividend return was 5.36%, leading to a total return of -8.49%.<BR><BR>For the 2-year period, the price return was 3.16%, the dividend return was 10.73%, resulting in a total return of 13.89%.<BR><BR>Over the last 3 years, the price return was 55.37%, the dividend return was 26.93%, which culminated in a total return of 82.3%.<BR><BR>In the 4-year period, the price return was 30.42%, the dividend return was 22.77%, leading to a total return of 53.19%.<BR><BR>For the 5-year period, the price return was 51.58%, the dividend return was 32.43%, resulting in a total return of 84.01%.<BR><BR>Overall, Accelya Solutions has declared a significant dividend and has shown varying total returns over different periods, with positive total returns in the longer terms, indicating potential growth despite recent price declines.

View full answer
iScoreScore
Click here to find our call on this stock
Strong Sell
Sell
Hold
Buy
Strong Buy

Dashboard

1

Poor long term growth as Net Sales has grown by an annual rate of 14.95% over the last 5 years

 
2

Flat results in Jun 26

3

Despite the size of the company, domestic mutual funds hold only 0% of the company

4

Consistent Underperformance against the benchmark over the last 3 years

stock-summaryMojo Parameters

Mojo Parameters

Loading Valuation Snapshot...

Stock DNA

stock-summary
Industry

Computers - Software & Consulting

stock-summary
Market cap

INR 1,713 Cr (Small Cap)

stock-summary
P/E

16.00

stock-summary
Industry P/E

21

stock-summary
Dividend Yield

7.28%

stock-summary
Debt Equity

-0.12

stock-summary
Return on Equity

44.29%

stock-summary
Price to Book

6.63

Revenue and Profits:
Net Sales:
127 Cr
(Quarterly Results - Jun 2026)
Net Profit:
30 Cr
stock-summaryTotal Returns
Total Returns (Price + Dividend) stock-summary
Dividend Yield (7.28%)
TimePeriod
Price Return
Dividend Return
Total Return
3 Months
-1.39%
0%
-1.39%
6 Months
-11.39%
3.42%
-7.97%
1 Year
-18.84%
6.08%
-12.76%
2 Years
-37.48%
9.91%
-27.57%
3 Years
-17.1%
15.81%
-1.29%
4 Years
25.26%
30.41%
55.67%
5 Years
-14.42%
27.24%
12.82%

Latest dividend: 45.16992487117964 per share ex-dividend date: Feb-06-2026

Risk Adjusted Returns v/s stock-summary
Returns Beta
Icon
Beta has not been calculated since enough price history is not available
stock-summaryNews & Corporate Actions

News

Announcements stock-summary

Accelya Solutions India Limited - Appointment

27-Nov-2019 | Source : NSE

Accelya Solutions India Limited has informed the Exchange regarding Appointment of Mr Jose Maria Hurtado as Non- Executive Director of the company w.e.f. November 27, 2019.Today we submitted an announcement under Regulation 30 of SEBI (LODR) Regulations.In the profile of Mr. Jose Maria Hurtado, it was erroneously mentioned that Mr. Jose Maria Hurtado is the Chief Executive Officer of Accelya Group. Please note that Mr. Jose Maria Hurtado is the Chief Financial Officer of Accelya Group and not the Chief Executive Officer.

Accelya Solutions India Limited - Open Offer

22-Nov-2019 | Source : NSE

Accelya Solutions India Limited has submitted to the Exchange a copy of Corrigendum dated November 22, 2019 to the Public Announcement dated November 19, 2019 ( the Corrigendum) in relation to open offer to the Public Shareholders of Accelya Solutions India Limited ( Target Company).

Accelya Solutions India Limited - Other General Purpose

26-Sep-2019 | Source : NSE

Accelya Solutions India Limited has informed the Exchange regarding Disclosure of Related party Transactions pursuant to Regulation 23(9) of the SEBI ( LODR) Regulations, 2015

Corporate Actions stock-summary

stock-summary
BOARD MEETING

No Upcoming Board Meetings

stock-summary
DIVIDEND

Accelya Solutions India Ltd has declared 450% dividend, ex-date: 06 Feb 26

stock-summary
SPLITS

No Splits history available

stock-summary
BONUS

No Bonus history available

stock-summary
RIGHTS

No Rights history available

stock-summaryKey Factors

Quality key factors stock-summary

Factor
Value
Sales Growth (5y)
12.89%
EBIT Growth (5y)
20.20%
EBIT to Interest (avg)
51.28
Debt to EBITDA (avg)
0.23
Net Debt to Equity (avg)
-0.12
Sales to Capital Employed (avg)
1.47
Tax Ratio
27.16%
Dividend Payout Ratio
104.13%
Pledged Shares
0
Institutional Holding
0.12%
ROCE (avg)
73.47%
ROE (avg)
37.13%

Valuation key factors

Factor
Value
P/E Ratio
16
Industry P/E
21
Price to Book Value
6.49
EV to EBIT
12.94
EV to EBITDA
9.65
EV to Capital Employed
7.24
EV to Sales
3.15
PEG Ratio
NA
Dividend Yield
7.44%
ROCE (Latest)
66.16%
ROE (Latest)
44.29%

Technicals key factors

Indicator
Weekly
Monthly
MACD
Mildly Bullish
Bearish
RSI
No Signal
No Signal
Bollinger Bands
Sideways
Mildly Bearish
Moving Averages
Mildly Bearish (Daily)
KST
Mildly Bullish
Bearish
Dow Theory
Mildly Bullish
Mildly Bullish
OBV
Mildly Bullish
Mildly Bearish
stock-summary Technical Indicator Scale: Bearish, Mildly Bearish, Sideways, Mildly Bullish, Bullish  Turned 
stock-summaryShareholding
Shareholding Snapshot : Jun 2026stock-summary
Shareholding Compare (%holding) stock-summary
Majority shareholders

Promoters

Pledged Promoter Holdings

None

Mutual Funds

Held by 1 Schemes (0.0%)

FIIs

Held by 14 FIIs (0.11%)

Promoter with highest holding

Accelya Holding World S L U (74.66%)

Highest Public shareholder

None

Individual Investors Holdings

20.74%

stock-summaryFinancial
[
  {
    "link": "quarterly",
    "btn_text": "All Quarterly Results",
    "header": "Quarterly Results Snapshot (Consolidated) - Jun'26 - QoQ",
    "rhs": [
      {
        "prefix": "Net Sales ",
        "suffix": "QoQ Growth in quarter ended Jun 2026 is -6.56% vs 2.38% in Mar 2026",
        "dir": -1
      },
      {
        "prefix": "Consolidated Net Profit ",
        "suffix": "QoQ Growth in quarter ended Jun 2026 is 42.42% vs 53.37% in Mar 2026",
        "dir": -1
      }
    ],
    "table": {
      "header": [
        "Jun'26",
        "Mar'26",
        "Change(%)"
      ],
      "body": [
        {
          "field": "Net Sales",
          "val1": "127.12",
          "val2": "136.05",
          "chgp": "-6.56%",
          "chgp_class": "negative"
        },
        {
          "field": "Operating Profit (PBDIT) excl Other Income",
          "val1": "46.11",
          "val2": "34.24",
          "chgp": "34.67%",
          "chgp_class": "positive"
        },
        {
          "field": "Interest",
          "val1": "0.42",
          "val2": "1.95",
          "chgp": "-78.46%",
          "chgp_class": "positive"
        },
        {
          "field": "Exceptional Items",
          "val1": "0.00",
          "val2": "0.00",
          "chgp": "",
          "chgp_class": "neutral"
        },
        {
          "field": "Consolidate Net Profit",
          "val1": "30.45",
          "val2": "21.38",
          "chgp": "42.42%",
          "chgp_class": "positive"
        },
        {
          "field": "Operating Profit Margin (Excl OI)",
          "val1": "36.27%",
          "val2": "25.17%",
          "chgp": "11.10%",
          "chgp_class": "positive"
        }
      ]
    }
  },
  {
    "link": "half-yearly",
    "btn_text": "All Half Yearly Results",
    "header": "Half Yearly Results Snapshot (Consolidated) - Dec'25",
    "rhs": [
      {
        "prefix": "Net Sales ",
        "suffix": " Growth in half year ended Dec 2025 is 3.39% vs 3.28% in Dec 2024",
        "dir": 1
      },
      {
        "prefix": "Consolidated Net Profit ",
        "suffix": " Growth in half year ended Dec 2025 is -32.81% vs 3.78% in Dec 2024",
        "dir": -1
      }
    ],
    "table": {
      "header": [
        "Dec'25",
        "Dec'24",
        "Change(%)"
      ],
      "body": [
        {
          "field": "Net Sales",
          "val1": "269.13",
          "val2": "260.30",
          "chgp": "3.39%",
          "chgp_class": "positive"
        },
        {
          "field": "Operating Profit (PBDIT) excl Other Income",
          "val1": "93.19",
          "val2": "96.83",
          "chgp": "-3.76%",
          "chgp_class": "negative"
        },
        {
          "field": "Interest",
          "val1": "4.57",
          "val2": "1.68",
          "chgp": "172.02%",
          "chgp_class": "negative"
        },
        {
          "field": "Exceptional Items",
          "val1": "-11.72",
          "val2": "0.00",
          "chgp": "",
          "chgp_class": "neutral"
        },
        {
          "field": "Consolidate Net Profit",
          "val1": "43.55",
          "val2": "64.82",
          "chgp": "-32.81%",
          "chgp_class": "negative"
        },
        {
          "field": "Operating Profit Margin (Excl OI)",
          "val1": "34.63%",
          "val2": "37.20%",
          "chgp": "-2.57%",
          "chgp_class": "negative"
        }
      ]
    }
  },
  {
    "link": "nine-monthly",
    "btn_text": "All Nine Monthly Results",
    "header": "Nine Monthly Results Snapshot (Consolidated) - Mar'26",
    "rhs": [
      {
        "prefix": "Net Sales ",
        "suffix": "YoY Growth in nine months ended Mar 2026 is 2.06% vs 3.64% in Mar 2025",
        "dir": -1
      },
      {
        "prefix": "Consolidated Net Profit ",
        "suffix": "YoY Growth in nine months ended Mar 2026 is -31.70% vs 51.72% in Mar 2025",
        "dir": -1
      }
    ],
    "table": {
      "header": [
        "Mar'26",
        "Mar'25",
        "Change(%)"
      ],
      "body": [
        {
          "field": "Net Sales",
          "val1": "405.18",
          "val2": "396.99",
          "chgp": "2.06%",
          "chgp_class": "positive"
        },
        {
          "field": "Operating Profit (PBDIT) excl Other Income",
          "val1": "127.43",
          "val2": "143.20",
          "chgp": "-11.01%",
          "chgp_class": "negative"
        },
        {
          "field": "Interest",
          "val1": "6.52",
          "val2": "2.40",
          "chgp": "171.67%",
          "chgp_class": "negative"
        },
        {
          "field": "Exceptional Items",
          "val1": "-11.72",
          "val2": "0.00",
          "chgp": "",
          "chgp_class": "neutral"
        },
        {
          "field": "Consolidate Net Profit",
          "val1": "64.93",
          "val2": "95.07",
          "chgp": "-31.70%",
          "chgp_class": "negative"
        },
        {
          "field": "Operating Profit Margin (Excl OI)",
          "val1": "31.45%",
          "val2": "36.07%",
          "chgp": "-4.62%",
          "chgp_class": "negative"
        }
      ]
    }
  },
  {
    "link": "annual",
    "btn_text": "All Annual Results",
    "header": "Annual Results Snapshot (Consolidated) - Jun'26",
    "rhs": [
      {
        "prefix": "Net Sales ",
        "suffix": "YoY Growth in year ended Jun 2026 is 0.67% vs 3.44% in Jun 2025",
        "dir": -1
      },
      {
        "prefix": "Consolidated Net Profit ",
        "suffix": "YoY Growth in year ended Jun 2026 is -26.07% vs 37.47% in Jun 2025",
        "dir": -1
      }
    ],
    "table": {
      "header": [
        "Jun'26",
        "Jun'25",
        "Change(%)"
      ],
      "body": [
        {
          "field": "Net Sales",
          "val1": "532.27",
          "val2": "528.72",
          "chgp": "0.67%",
          "chgp_class": "positive"
        },
        {
          "field": "Operating Profit (PBDIT) excl Other Income",
          "val1": "173.10",
          "val2": "192.96",
          "chgp": "-10.29%",
          "chgp_class": "negative"
        },
        {
          "field": "Interest",
          "val1": "6.94",
          "val2": "3.42",
          "chgp": "102.92%",
          "chgp_class": "negative"
        },
        {
          "field": "Exceptional Items",
          "val1": "-11.72",
          "val2": "0.00",
          "chgp": "",
          "chgp_class": "neutral"
        },
        {
          "field": "Consolidate Net Profit",
          "val1": "95.38",
          "val2": "129.02",
          "chgp": "-26.07%",
          "chgp_class": "negative"
        },
        {
          "field": "Operating Profit Margin (Excl OI)",
          "val1": "32.52%",
          "val2": "36.50%",
          "chgp": "-3.98%",
          "chgp_class": "negative"
        }
      ]
    }
  }
]

Quarterly Results Snapshot (Consolidated) - Jun'26 - QoQstock-summary

Jun'26
Mar'26
Change(%)
Net Sales
127.12
136.05
-6.56%
Operating Profit (PBDIT) excl Other Income
46.11
34.24
34.67%
Interest
0.42
1.95
-78.46%
Exceptional Items
0.00
0.00
Consolidate Net Profit
30.45
21.38
42.42%
Operating Profit Margin (Excl OI)
36.27%
25.17%
11.10%
Values in Rs Cr.
Direction Arrows
Net Sales

QoQ Growth in quarter ended Jun 2026 is -6.56% vs 2.38% in Mar 2026

Direction Arrows
Consolidated Net Profit

QoQ Growth in quarter ended Jun 2026 is 42.42% vs 53.37% in Mar 2026

Half Yearly Results Snapshot (Consolidated) - Dec'25stock-summary

Dec'25
Dec'24
Change(%)
Net Sales
269.13
260.30
3.39%
Operating Profit (PBDIT) excl Other Income
93.19
96.83
-3.76%
Interest
4.57
1.68
172.02%
Exceptional Items
-11.72
0.00
Consolidate Net Profit
43.55
64.82
-32.81%
Operating Profit Margin (Excl OI)
34.63%
37.20%
-2.57%
Values in Rs Cr.
Direction Arrows
Net Sales

Growth in half year ended Dec 2025 is 3.39% vs 3.28% in Dec 2024

Direction Arrows
Consolidated Net Profit

Growth in half year ended Dec 2025 is -32.81% vs 3.78% in Dec 2024

Nine Monthly Results Snapshot (Consolidated) - Mar'26stock-summary

Mar'26
Mar'25
Change(%)
Net Sales
405.18
396.99
2.06%
Operating Profit (PBDIT) excl Other Income
127.43
143.20
-11.01%
Interest
6.52
2.40
171.67%
Exceptional Items
-11.72
0.00
Consolidate Net Profit
64.93
95.07
-31.70%
Operating Profit Margin (Excl OI)
31.45%
36.07%
-4.62%
Values in Rs Cr.
Direction Arrows
Net Sales

YoY Growth in nine months ended Mar 2026 is 2.06% vs 3.64% in Mar 2025

Direction Arrows
Consolidated Net Profit

YoY Growth in nine months ended Mar 2026 is -31.70% vs 51.72% in Mar 2025

Annual Results Snapshot (Consolidated) - Jun'26stock-summary

Jun'26
Jun'25
Change(%)
Net Sales
532.27
528.72
0.67%
Operating Profit (PBDIT) excl Other Income
173.10
192.96
-10.29%
Interest
6.94
3.42
102.92%
Exceptional Items
-11.72
0.00
Consolidate Net Profit
95.38
129.02
-26.07%
Operating Profit Margin (Excl OI)
32.52%
36.50%
-3.98%
Values in Rs Cr.
Direction Arrows
Net Sales

YoY Growth in year ended Jun 2026 is 0.67% vs 3.44% in Jun 2025

Direction Arrows
Consolidated Net Profit

YoY Growth in year ended Jun 2026 is -26.07% vs 37.47% in Jun 2025

stock-summaryCompany CV
About Accelya Solutions India Ltd stock-summary
stock-summary
Accelya Solutions India Ltd
Small Cap
Computers - Software & Consulting
Accelya Solutions India Limited was erstwhile established as Kale Consultants Limited on September 25, 1986. The Company changed the name from Kale Consultants Limited to Accelya Kale Solutions Limited on July 23, 2012 and thereafter changed to 'Accelya Solutions India Limited' on February 28, 2019. Promoted by technocrat entrepreneurs, Narendra Kale and Vipul Jain in 1986, Company is a software solutions provider to the global Airline and Travel industry.
Company Coordinates stock-summary
Company Details
Accelya Enclave 685/2B&2C 1st, Flr Sharada Arcade Satara Road Pune Maharashtra : 411037
stock-summary
Tel: 91-20-66083777
stock-summary
info@kaleconsultants.com
Registrar Details
Karvy Computershare Pvt Ltd, Plot No 17-24 , Near Image Hospital,, Reliance Cybervilae,Vithalrao Nagar,, Madhapur, Hyderabad