
Compare Aegis Logistics with Similar Stocks
Dashboard
High Management Efficiency with a high ROCE of 17.31%
Strong ability to service debt as the company has a low Debt to EBITDA ratio of 2.86 times
Healthy long term growth as Operating profit has grown by an annual rate 31.71%
With a growth in Net Profit of 95.43%, the company declared Very Positive results in Mar 26
High Institutional Holdings at 23.23%
Market Beating performance in long term as well as near term
Total Returns (Price + Dividend) 
Latest dividend: 6 per share ex-dividend date: Jul-18-2025
Risk Adjusted Returns v/s
Returns Beta

News
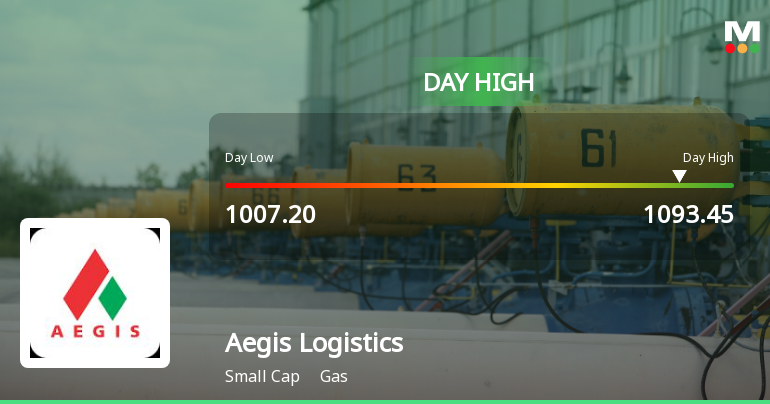
Aegis Logistics Ltd Surges 7.09% to Day's High of Rs 1093.45 — Outperforms Sector by 4.82 Percentage Points
The Sensex advanced 0.47% on 22 Jun 2026, yet Aegis Logistics Ltd outpaced the broader market with a 7.09% gain, reaching an intraday high of Rs 1093.45. This 4.82-percentage-point outperformance over the Gas sector’s 2.88% rise signals a distinctly stock-specific momentum surge rather than a market-wide lift.
Read full news article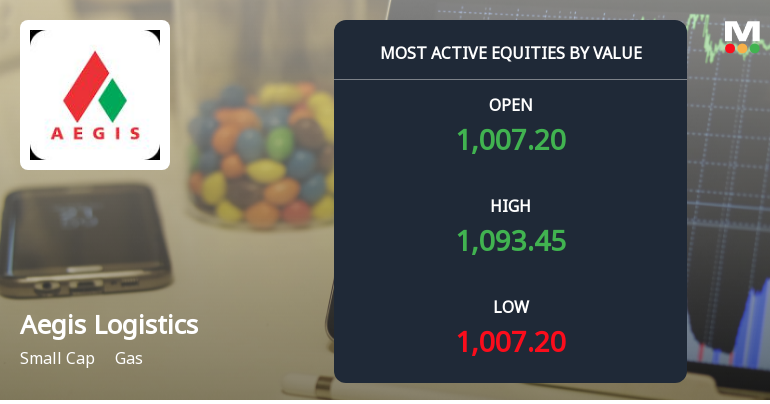
Aegis Logistics Ltd Surges on High-Value Trading and Institutional Interest
Aegis Logistics Ltd (AEGISLOG) has emerged as one of the most actively traded stocks by value on 22 June 2026, registering a robust 6.36% gain and hitting a new 52-week high of Rs. 1,093.55. The small-cap gas sector company has attracted significant institutional interest and large order flows, outperforming its sector and broader market indices amid strong momentum and improving investor sentiment.
Read full news article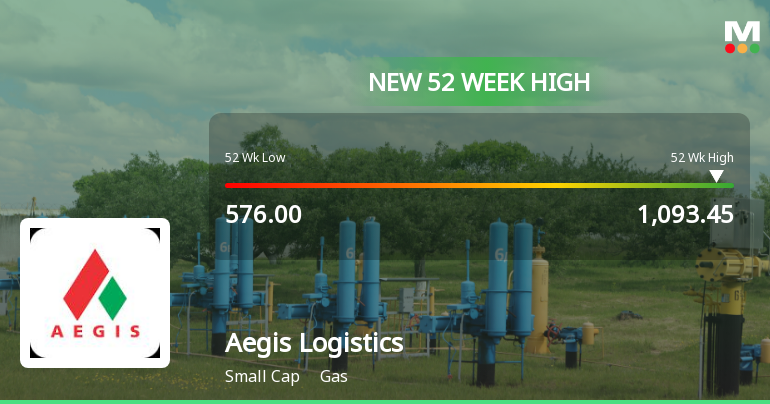
Broad-Based Technical Strength Lifts Aegis Logistics Ltd to 52-Week High of Rs 1093.45
With a decisive break above Rs 1093.45 on 22 Jun 2026, Aegis Logistics Ltd has reached a fresh 52-week high, propelled by a confluence of strong technical indicators and sustained price momentum that outpaces its sector and the broader market.
Read full news article Announcements
Announcement under Regulation 30 (LODR)-Analyst / Investor Meet - Intimation
18-Jun-2026 | Source : BSEIntimation for Investor/Analyst meet is attached.
Announcement under Regulation 30 (LODR)-Analyst / Investor Meet - Intimation
18-Jun-2026 | Source : BSEIntimation for Investor/Analyst meet is attached.
Announcement under Regulation 30 (LODR)-Analyst / Investor Meet - Intimation
18-Jun-2026 | Source : BSEIntimation for Investor/Analyst meet is attached.
Corporate Actions

No Upcoming Board Meetings

Aegis Logistics Ltd has declared 600% dividend, ex-date: 18 Jul 25

Aegis Logistics Ltd has announced 1:10 stock split, ex-date: 16 Sep 15

Aegis Logistics Ltd has announced 2:3 bonus issue, ex-date: 18 Aug 10

No Rights history available
Quality key factors
Valuation key factors
Technicals key factors
 Technical Indicator Scale: Bearish, Mildly Bearish, Sideways, Mildly Bullish, Bullish Turned
 Shareholding Snapshot : Mar 2026
Shareholding Compare (%holding)
Promoters
None
Held by 21 Schemes (3.36%)
Held by 153 FIIs (19.56%)
Huron Holdings Limited (31.67%)
Sudhir Omprakash Malhotra (4.46%)
9.79%
Quarterly Results Snapshot (Consolidated) - Mar'26 - QoQ

QoQ Growth in quarter ended Mar 2026 is 50.36% vs -24.79% in Dec 2025
QoQ Growth in quarter ended Mar 2026 is 132.07% vs -1.56% in Dec 2025
Half Yearly Results Snapshot (Consolidated) - Sep'25
Growth in half year ended Sep 2025 is 19.74% vs 0.49% in Sep 2024
Growth in half year ended Sep 2025 is 20.78% vs 6.04% in Sep 2024
Nine Monthly Results Snapshot (Consolidated) - Dec'25
YoY Growth in nine months ended Dec 2025 is 13.44% vs -2.88% in Dec 2024
YoY Growth in nine months ended Dec 2025 is 27.79% vs 2.35% in Dec 2024
Annual Results Snapshot (Consolidated) - Mar'26
YoY Growth in year ended Mar 2026 is 23.20% vs -4.00% in Mar 2025
YoY Growth in year ended Mar 2026 is 35.39% vs 16.54% in Mar 2025
About Aegis Logistics Ltd

Company Coordinates


