
Compare Affordable Robo. with Similar Stocks
Dashboard
Low ability to service debt as the company has a high Debt to EBITDA ratio of 3.71 times
- Poor long term growth as Net Sales has grown by an annual rate of 14.20% over the last 5 years
- Low ability to service debt as the company has a high Debt to EBITDA ratio of 3.71 times
- The company has been able to generate a Return on Equity (avg) of 3.16% signifying low profitability per unit of shareholders funds
Consistent Underperformance against the benchmark over the last 3 years
Stock DNA
Industrial Manufacturing
INR 213 Cr (Micro Cap)
31.00
35
0.00%
0.56
6.32%
1.96
Total Returns (Price + Dividend) 
Affordable Robo. for the last several years.
Risk Adjusted Returns v/s
Returns Beta

News

Affordable Robotic & Automation Ltd is Rated Sell
Affordable Robotic & Automation Ltd is rated 'Sell' by MarketsMOJO, with this rating last updated on 25 May 2026. However, the analysis and financial metrics discussed here reflect the company’s current position as of 26 July 2026, providing investors with an up-to-date view of the stock’s fundamentals, returns, and technical outlook.
Read full news article
Affordable Robotic & Automation Ltd Locks at Lower Circuit With 5.0% Loss — Sellers Queue, No Buyers in Sight
At Rs 186.22, sellers were still queuing — but there were no buyers willing to take the other side. Affordable Robotic & Automation Ltd locked at its lower circuit of 5.0% on 22 Jul 2026, with unfilled sell orders and a frozen price.
Read full news article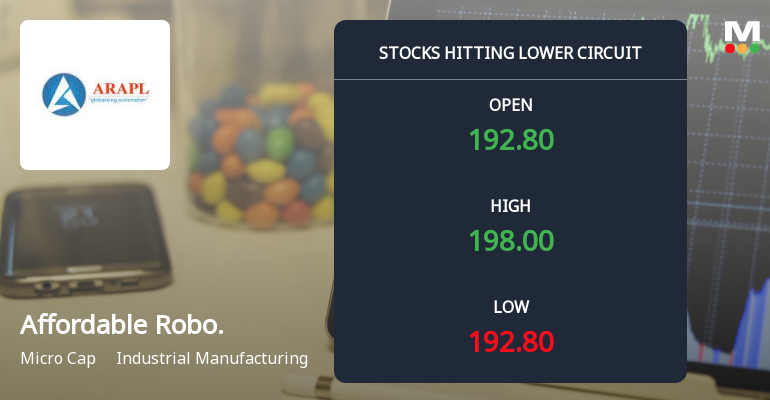
Affordable Robotic & Automation Ltd Locks at Lower Circuit With 5.0% Loss — Sellers Queue, No Buyers in Sight
At Rs 191.44, sellers were still queuing — but there were no buyers willing to take the other side. Affordable Robotic & Automation Ltd locked at its lower circuit of 5.0% on 20 Jul 2026, with unfilled sell orders and a frozen price that capped losses for the day.
Read full news article Announcements
Announcement under Regulation 30 (LODR)-Press Release / Media Release
23-Jul-2026 | Source : BSEPursuant to Regulation 30 of SEBI (LODR) Regulations 2015 please find attached Press release.
Announcement under Regulation 30 (LODR)-Newspaper Publication
21-Jul-2026 | Source : BSESubmission of Newspaper Advertisement of Postal Ballot Notice
Shareholder Meeting / Postal Ballot-Notice of Postal Ballot
20-Jul-2026 | Source : BSEDisclosure under regulation 30 of SEBI (LODR) Regulations 2015-Postal Ballot Notice
Corporate Actions

No Upcoming Board Meetings

No Dividend history available

No Splits history available

No Bonus history available

Affordable Robotic & Automation Ltd has announced 46:439 rights issue, ex-date: 12 Feb 24
Quality key factors
Valuation key factors
Technicals key factors
 Technical Indicator Scale: Bearish, Mildly Bearish, Sideways, Mildly Bullish, Bullish Turned
 Shareholding Snapshot : Jun 2026
Shareholding Compare (%holding)
Non Institution
None
Held by 0 Schemes
Held by 3 FIIs (1.09%)
Milind Manohar Padole (27.74%)
Vijay Kishanlal Kedia (7.01%)
42.09%
Quarterly Results Snapshot (Consolidated) - Mar'26 - QoQ

QoQ Growth in quarter ended Mar 2026 is 155.54% vs -28.92% in Dec 2025
QoQ Growth in quarter ended Mar 2026 is 264.89% vs -71.33% in Dec 2025
Half Yearly Results Snapshot (Consolidated) - Sep'25
Growth in half year ended Sep 2025 is 7.07% vs -63.65% in Sep 2024
Growth in half year ended Sep 2025 is 107.16% vs -192.97% in Sep 2024
Nine Monthly Results Snapshot (Consolidated) - Dec'25
YoY Growth in nine months ended Dec 2025 is -14.59% vs -16.64% in Dec 2024
YoY Growth in nine months ended Dec 2025 is 115.70% vs -594.03% in Dec 2024
Annual Results Snapshot (Consolidated) - Mar'26

YoY Growth in year ended Mar 2026 is -27.61% vs -0.33% in Mar 2025
YoY Growth in year ended Mar 2026 is 159.83% vs -281.18% in Mar 2025
About Affordable Robotic & Automation Ltd

Company Coordinates


