
Compare Amal with Similar Stocks
Dashboard
Flat results in Mar 26
- PAT(Q) At Rs 1.90 cr has Fallen at -72.1% (vs previous 4Q average)
- OPERATING PROFIT TO NET SALES(Q) Lowest at 9.72%
- PBDIT(Q) Lowest at Rs 7.36 cr.
With ROE of 18.6, it has a Expensive valuation with a 6.1 Price to Book Value
Despite the size of the company, domestic mutual funds hold only 0.03% of the company
Stock DNA
Specialty Chemicals
INR 723 Cr (Micro Cap)
33.00
20
0.17%
-0.32
18.59%
6.09
Total Returns (Price + Dividend) 
Latest dividend: 1 per share ex-dividend date: Aug-14-2025
Risk Adjusted Returns v/s
Returns Beta

News
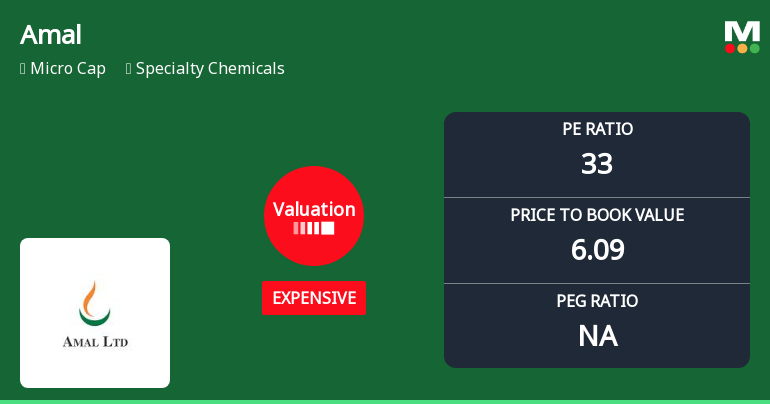
Amal Ltd’s Valuation Shifts Signal Growing Price Pressure Amid Specialty Chemicals Sector Dynamics
Amal Ltd, a micro-cap player in the Specialty Chemicals sector, has seen its valuation parameters shift notably, with its price-to-earnings (P/E) and price-to-book value (P/BV) ratios moving into expensive territory. This re-rating comes amid mixed returns relative to the broader market and peers, prompting a downgrade in its Mojo Grade from Hold to Sell as of 1 Dec 2025.
Read full news article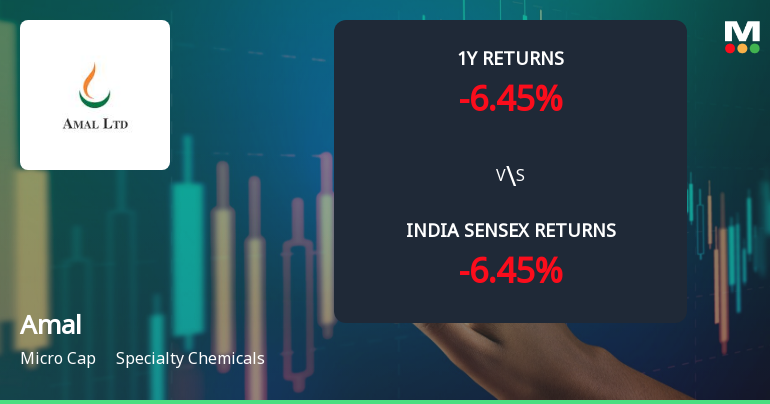
Amal Ltd Technical Momentum Shifts Amid Mixed Market Signals
Amal Ltd, a micro-cap player in the Specialty Chemicals sector, has experienced a notable shift in price momentum, reflected in a complex blend of technical indicator signals. Despite a robust day change of 8.25%, the company’s overall technical trend has transitioned from mildly bearish to sideways, prompting a downgrade in its Mojo Grade from Hold to Sell as of 1 Dec 2025.
Read full news article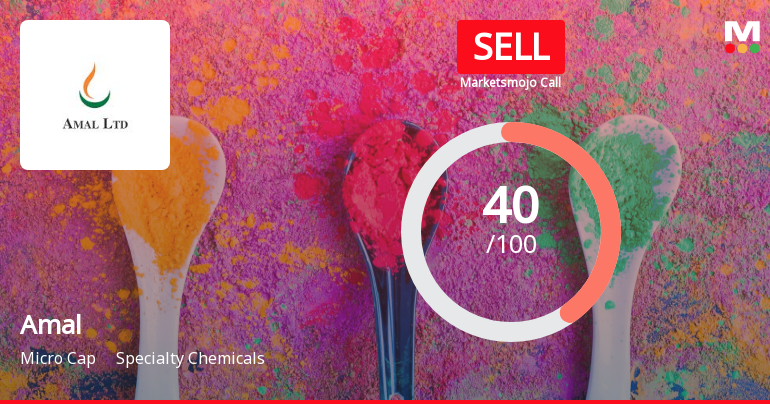
Amal Ltd is Rated Sell by MarketsMOJO
Amal Ltd is rated Sell by MarketsMOJO, with this rating last updated on 01 Dec 2025. However, the analysis and financial metrics discussed here reflect the company’s current position as of 20 June 2026, providing investors with an up-to-date view of its fundamentals, returns, and market standing.
Read full news article Announcements
Compliances-Reg.24(A)-Annual Secretarial Compliance
19-May-2026 | Source : BSEAnnual Secretarial Compliance for the year ended March 2026
Record Date For Dividend Purpose
30-Apr-2026 | Source : BSEPlease note that the record date for dividend purpose is July 31 2026.
Board Meeting Outcome for Outcome Of Board Meeting
22-Apr-2026 | Source : BSEOutcome of Board meeting
Corporate Actions

No Upcoming Board Meetings

Amal Ltd has declared 15% dividend, ex-date: 31 Jul 26

No Splits history available

No Bonus history available

Amal Ltd has announced 24:77 rights issue, ex-date: 21 Feb 23
Quality key factors
Valuation key factors
Technicals key factors
 Technical Indicator Scale: Bearish, Mildly Bearish, Sideways, Mildly Bullish, Bullish Turned
 Shareholding Snapshot : Mar 2026
Shareholding Compare (%holding)
Promoters
None
Held by 3 Schemes (0.01%)
Held by 0 FIIs
Atul Finserv Limited (48.48%)
None
26.85%
Quarterly Results Snapshot (Consolidated) - Mar'26 - QoQ

QoQ Growth in quarter ended Mar 2026 is 21.01% vs 15.91% in Dec 2025

QoQ Growth in quarter ended Mar 2026 is -62.15% vs -17.16% in Dec 2025
Half Yearly Results Snapshot (Consolidated) - Sep'25
Growth in half year ended Sep 2025 is 100.38% vs 29.61% in Sep 2024
Growth in half year ended Sep 2025 is 158.96% vs 741.94% in Sep 2024
Nine Monthly Results Snapshot (Consolidated) - Dec'25
YoY Growth in nine months ended Dec 2025 is 70.11% vs 48.50% in Dec 2024
YoY Growth in nine months ended Dec 2025 is -9.02% vs 1,579.85% in Dec 2024
Annual Results Snapshot (Consolidated) - Mar'26
YoY Growth in year ended Mar 2026 is 77.09% vs 57.18% in Mar 2025
YoY Growth in year ended Mar 2026 is -23.59% vs 1,622.94% in Mar 2025
About Amal Ltd

Company Coordinates


